
Subpart (a):
The
Subpart (a):
Explanation of Solution
Demand curve: The demand equation is
Supply curve: The supply equation is
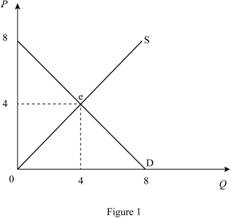
In Figure 1, horizontal axis measures quantity and vertical axis measures price. The curve D indicates demand and the curve S indicates supply. Market reaches the equilibrium at point ‘e’ where the demand curve intersects with supply curve.
Equilibrium price can be calculated as follows.
Equilibrium price is $4.
Thus, equilibrium quantity is 4 units.
Consumer surplus is $8.
Producer surplus is $8.
Total surplus can be calculated as follows.
Total surplus is $16.
Concept introduction:
Consumer surplus: It is the difference between the highest willing price of the consumer and the actual price that the consumer pays.
Producer surplus: It is the difference between the minimum accepted price for the producer and the actual price received by the producer.
Equilibrium price: It is the market price determined by equating the supply to the demand. At this equilibrium point, the supply will be equal to the demand and there will be no excess demand or
Subpart (b):
The equilibrium price and the quantity of haircuts and total surplus.
Subpart (b):
Explanation of Solution
The world price for the good is $1. Thus, when the country opens the market for trade, the price becomes $1 in domestic country too. Figure 2 describe this situation.
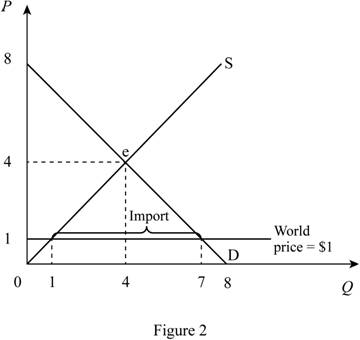
In Figure 2, horizontal axis measures quantity and vertical axis measures price. The curve D indicates demand and the curve S indicates supply. Market reaches the equilibrium at point ‘e’ where the demand curve intersects with supply curve.
When the competitor (Rest of the world) sells a good at price $1, in domestic country equilibrium price become equal to world price. Thus, equilibrium price in the domestic country is $1.
Equilibrium domestic supply can be calculated by substituting the domestic equilibrium price in to supply equation.
Thus, equilibrium quantity is 1 unit.
Equilibrium domestic demand can be calculated by substituting the domestic equilibrium price in to demand equation.
Thus, equilibrium domestic demand is 7 units.
Total imports can be calculated as follows.
Domestic imports are 6 units.
Consumer surplus can be calculated as follows.
Consumer surplus is $24.5.
Producer surplus can be calculated as follows.
Producer surplus is $0.5.
Total surplus can be calculated as follows.
Total surplus is $25.
Concept introduction:
Consumer surplus: It is the difference between the highest willing price of the consumer and the actual price that the consumer pays.
Producer surplus: It is the difference between the minimum accepted price for the producer and the actual price received by the producer.
Equilibrium price: It is the market price determined by equating the supply to the demand. At this equilibrium point, the supply will be equal to the demand and there will be no excess demand or excess supply in an economy. Thus, the economy will be at equilibrium.
Subpar (c):
The equilibrium price and the quantity of haircuts and total surplus.
Subpar (c):
Explanation of Solution
When domestic country impose tariff of $1, the price in domestic country increases from $1 to $2. This increase in price is shown in the Figure 3.
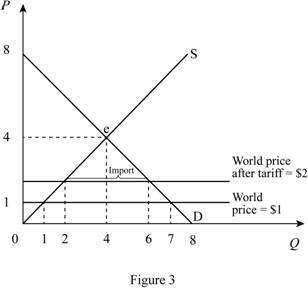
In Figure 3, horizontal axis measures quantity and vertical axis measures price. The curve D indicates demand and the curve S indicates supply. Market reaches the equilibrium at point ‘e’ where the demand curve intersects with supply curve. Price is increases from $1 to $2 due to the tariff of $1.
Domestic equilibrium price can be calculated as follows.
New domestic price is $2.
Equilibrium domestic supply can be calculated by substituting the domestic equilibrium price in to supply equation.
Thus, equilibrium quantity is 2 units.
Equilibrium domestic demand can be calculated by substituting the domestic equilibrium price in to demand equation.
Thus, equilibrium domestic demand is 6 units.
Total imports can be calculated as follows.
Domestic imports are 4 units.
Consumer surplus can be calculated as follows.
Consumer surplus is $18.
Producer surplus can be calculated as follows.
Producer surplus is $2.
Government revenue can be calculated as follows.
Government revenue is 4.
Total surplus can be calculated as follows.
Total surplus is $24.
Concept introduction:
Consumer surplus: It is the difference between the highest willing price of the consumer and the actual price that the consumer pays.
Producer surplus: It is the difference between the minimum accepted price for the producer and the actual price received by the producer.
Equilibrium price: It is the market price determined by equating the supply to the demand. At this equilibrium point, the supply will be equal to the demand and there will be no excess demand or excess supply in an economy. Thus, the economy will be at equilibrium.
Subpart (d):
Calculate total gains and
Subpart (d):
Explanation of Solution
Total gains from opening up trade can be calculated as follows.
Total gains are$8.
Deadweight loss can be calculated as follows.
Deadweight loss is $1.
Want to see more full solutions like this?
Chapter 9 Solutions
Bundle: Principles of Macroeconomics, Loose-Leaf Version, 7th + Aplia, 1 term Printed Access Card

- a-c pleasearrow_forwardd-farrow_forwardPART II: Multipart Problems wood or solem of triflussd aidi 1. Assume that a society has a polluting industry comprising two firms, where the industry-level marginal abatement cost curve is given by: MAC = 24 - ()E and the marginal damage function is given by: MDF = 2E. What is the efficient level of emissions? b. What constant per-unit emissions tax could achieve the efficient emissions level? points) c. What is the net benefit to society of moving from the unregulated emissions level to the efficient level? In response to industry complaints about the costs of the tax, a cap-and-trade program is proposed. The marginal abatement cost curves for the two firms are given by: MAC=24-E and MAC2 = 24-2E2. d. How could a cap-and-trade program that achieves the same level of emissions as the tax be designed to reduce the costs of regulation to the two firms?arrow_forward
- Only #4 please, Use a graph please if needed to help provearrow_forwarda-carrow_forwardFor these questions, you must state "true," "false," or "uncertain" and argue your case (roughly 3 to 5 sentences). When appropriate, the use of graphs will make for stronger answers. Credit will depend entirely on the quality of your explanation. 1. If the industry facing regulation for its pollutant emissions has a lot of political capital, direct regulatory intervention will be more viable than an emissions tax to address this market failure. 2. A stated-preference method will provide a measure of the value of Komodo dragons that is more accurate than the value estimated through application of the travel cost model to visitation data for Komodo National Park in Indonesia. 3. A correlation between community demographics and the present location of polluting facilities is sufficient to claim a violation of distributive justice. olsvrc Q 4. When the damages from pollution are uncertain, a price-based mechanism is best equipped to manage the costs of the regulator's imperfect…arrow_forward
- For environmental economics, question number 2 only please-- thank you!arrow_forwardFor these questions, you must state "true," "false," or "uncertain" and argue your case (roughly 3 to 5 sentences). When appropriate, the use of graphs will make for stronger answers. Credit will depend entirely on the quality of your explanation. 1. If the industry facing regulation for its pollutant emissions has a lot of political capital, direct regulatory intervention will be more viable than an emissions tax to address this market failure. cullog iba linevoz ve bubivorearrow_forwardExercise 3 The production function of a firm is described by the following equation Q=10,000-3L2 where L stands for the units of labour. a) Draw a graph for this equation. Use the quantity produced in the y-axis, and the units of labour in the x-axis. b) What is the maximum production level? c) How many units of labour are needed at that point? d) Provide one reference with you answer.arrow_forward
- Exercise 1 Consider the market supply curve which passes through the intercept and from which the market equilibrium data is known, this is, the price and quantity of equilibrium PE=50 and QE=2000. Considering those two points, find the equation of the supply. Draw a graph of this line. Provide one reference with your answer. Exercise 2 Considering the previous supply line, determine if the following demand function corresponds to the market demand equilibrium stated above. QD=3000-2p.arrow_forwardConsider the market supply curve which passes through the intercept and from which the marketequilibrium data is known, this is, the price and quantity of equilibrium PE=50 and QE=2000.a. Considering those two points, find the equation of the supply. b. Draw a graph of this line.arrow_forwardGovernment Purchases and Tax Revenues A B GDP T₂ Refer to the diagram. Discretionary fiscal policy designed to slow the economy is illustrated by Multiple Choice the shift of curve T₁ to T2. a movement from d to balong curve T₁.arrow_forward
 Principles of MicroeconomicsEconomicsISBN:9781305156050Author:N. Gregory MankiwPublisher:Cengage Learning
 Principles of Economics, 7th Edition (MindTap Cou...EconomicsISBN:9781285165875Author:N. Gregory MankiwPublisher:Cengage Learning
 Principles of Macroeconomics (MindTap Course List)EconomicsISBN:9781285165912Author:N. Gregory MankiwPublisher:Cengage Learning
 Microeconomics: Private and Public Choice (MindTa...EconomicsISBN:9781305506893Author:James D. Gwartney, Richard L. Stroup, Russell S. Sobel, David A. MacphersonPublisher:Cengage Learning
 Macroeconomics: Private and Public Choice (MindTa...EconomicsISBN:9781305506756Author:James D. Gwartney, Richard L. Stroup, Russell S. Sobel, David A. MacphersonPublisher:Cengage Learning
 Economics: Private and Public Choice (MindTap Cou...EconomicsISBN:9781305506725Author:James D. Gwartney, Richard L. Stroup, Russell S. Sobel, David A. MacphersonPublisher:Cengage Learning