
Subpart (a):
The impact of free trade on the country.
Subpart (a):
Explanation of Solution
Here, in the case of the country, the domestic price was $20 and the quantity demanded and supplied was 3 million. Thus, the economy was in its initial equilibrium without trade. When free trade was allowed, the price fell to the world price of $16 and the quantity demanded increased to 4 million, whereas the quantity supplied decreased to just 1 million. This can be illustrated on the graph as follows:
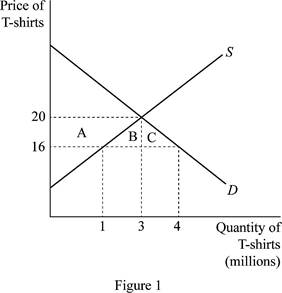
In figure 1, horizontal axis measures quantity and vertical axis measures price. The curve ‘S” and “D’ indicates
Concept introduction:
International trade: It is the trade relation between the countries.
Export: It is the process of selling domestic goods in the international market. Thus, the goods produced in the domestic firms will be sold to other foreign countries. So, it is the outflow of domestic goods and services to the foreign economy.
Import: It is the process of purchasing the foreign-made goods and services by the domestic country. Thus, it is the inflow of foreign goods and services to the domestic economy.
Sub part (b):
The impact of free trade on the country.
Sub part (b):
Explanation of Solution
From the graph, we can easily identify that the
Thus, the increase in the consumer surplus can be calculated by adding these together as follows:
Thus, the consumer surplus increases by $14 million.
Before free trade, the
The total surplus of the economy after the trade increases by the areas of B+C, which means that the total surplus of the economy has increased by $6 million.
Concept introduction:
International trade: It is the trade relation between the countries.
Export: It is the process of selling domestic goods in the international market. Thus, the goods produced in the domestic firms will be sold to other foreign countries. So, it is the outflow of domestic goods and services to the foreign economy.
Import: It is the process of purchasing the foreign-made goods and services by the domestic country. Thus, it is the inflow of foreign goods and services to the domestic economy.
Comparative advantage: It is the ability of the country to produce the goods and services at lower opportunity costs than other countries.
Want to see more full solutions like this?
Chapter 9 Solutions
Bundle: Principles of Microeconomics, 7th + Aplia, 1 term Printed Access Card

- Using the graph on the right, determine the per unit prices of capital and labour. 20- Given the information provided about the isocost lines, we know that the per unit price of capital is TC=$100 and the per unit price of labour is 16- TC $80 ○ A. $50; $20 ○ B. $2; $5 ○ C. $5; $2 ○ D. $20; $50 E. not determinable; not determinable Quantity of K 12 TC $60 TC $40 0 10 20 30 Quantity of L 40arrow_forwardThe diagram to the right contains isocost lines A and B. If the price of capital is the same for both lines, then the difference between isocost line A and isocost line B is that OA. the total cost is larger along B. B. the level of output is lower along A. C. both capital and labour are cheaper along A. OD. labour is more expensive along A. ○ E. labour is more expensive along B. Capital Labourarrow_forwardFor the firm whose cost curves are shown at right, the minimum efficient scale is ○ A. between 60 and 140 units of production. OB. about 20 units of production. OC. about 60 units of production. OD. about 100 units of production. OE. the level of fixed cost corresponding to SRATC2. SRATC₁ LRAC SRATC4 SRATC₂ SRATC3 เนด เad iso C 20 20 40 60 80 100 120 140 160 180 200 Output per Periodarrow_forward
- SRATC₂ SRATC3 In the figure, increasing long-run average total costs for the firm are confined to the output range OA. where the LRAC curve is downward sloping. B. above 80 units of output. O C. above 50 units of output. OD. between 50 and 80 units of output. SRATC₁ OE. between 10 and 100 units of output. ---- SRATC LRAC 10 20 30 40 50 60 70 80 90 100 Output per Periodarrow_forwardFor the firm whose cost curves are shown at right, the minimum efficient scale is OA. between 10 and 50 units of production. OB. about 80 units of production. O C. the level of fixed cost corresponding to SRATC₁. OD. about 10 units of production. ○ E. about 50 units of production. Cost per Unit SRATC₁ LRAC SRATC2 SRATC4 SRATC3 10 20 30 40 50 60 70 80 Output per Period 90 100arrow_forward• 3 different people working at any companies under the BPO industry in the Philippines. • What are the 3 different Vision, Mission, Duties and Responsibilities and Career Path of these people in their companies under the BPO industry?arrow_forward
- Module 6 ⚫(1902) Buckner C X | (1902) How to d x (1902) Buckner F X (1902) Productic X WP Videoplayer Canvas Login | Ir x | + Σ R mybrcc.instructure.com/courses/417310/discussion_topics/3420114?module_item_id=20155705 Spring 2025 Home Announcements Modules Syllabus Grades 8 People BRCC-_Library DLASC Module 6 Discussion - Business Costs Relaunch to update For this discussion, think about where you work or a business you have a significant amount of knowledge about. What is a common product that the business sells? What are the main costs the business has to incur in order to be able to sell that product? Which of these costs are fixed and which are variable? How much additional costs would be incurred if it were to sell one additional unit of that product (marginal cost)? Write a discussion thread about this business, the product it commonly sells, and your answers to the above questions. Also, respond to at least two threads created by your classmates. In these responses, share what…arrow_forwardRefer to the video to answer the following: • what are all the key policies or all the strategies the Philippine government should prioritize to accelerate sustainable economic growth? • these should consider the Philippines current economic challenges, including inflation, unemployment, and the need for digital transformation. "The Philippines' Strong Economic Growth" (YouTube link: https://youtu.be/1YtEoGp2ZeM?siJQfIv5kbu0txVsLL.)arrow_forwardsolve about this qarrow_forward

 Principles of Macroeconomics (MindTap Course List)EconomicsISBN:9781285165912Author:N. Gregory MankiwPublisher:Cengage Learning
 Principles of Economics, 7th Edition (MindTap Cou...EconomicsISBN:9781285165875Author:N. Gregory MankiwPublisher:Cengage Learning
 Microeconomics: Private and Public Choice (MindTa...EconomicsISBN:9781305506893Author:James D. Gwartney, Richard L. Stroup, Russell S. Sobel, David A. MacphersonPublisher:Cengage Learning
 Macroeconomics: Private and Public Choice (MindTa...EconomicsISBN:9781305506756Author:James D. Gwartney, Richard L. Stroup, Russell S. Sobel, David A. MacphersonPublisher:Cengage Learning
 Economics: Private and Public Choice (MindTap Cou...EconomicsISBN:9781305506725Author:James D. Gwartney, Richard L. Stroup, Russell S. Sobel, David A. MacphersonPublisher:Cengage Learning