Subpart (a):
The impact of free trade on the country.
Subpart (a):
Explanation of Solution
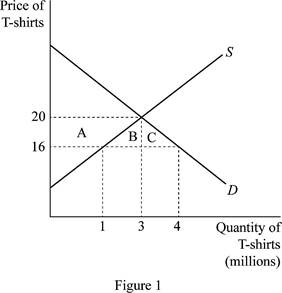
Here, in the case of the country, the domestic price was $20 and the quantity demanded and supplied was 3 million. Thus, the economy was in its initial equilibrium without trade. When free trade was allowed, the price fell to the world price of $16 and the quantity demanded increased to 4 million, whereas the quantity supplied decreased to just 1 million. This can be illustrated on the graph as follows:

In figure 1, horizontal axis measures quantity and vertical axis measures price. The curve ‘S” and “D’ indicates
Concept introduction:
International trade: It is the trade relation between the countries.
Export: It is the process of selling domestic goods in the international market. Thus, the goods produced in the domestic firms will be sold to other foreign countries. So, it is the outflow of domestic goods and services to the foreign economy.
Import: It is the process of purchasing the foreign-made goods and services by the domestic country. Thus, it is the inflow of foreign goods and services to the domestic economy.
Sub part (b):
The impact of free trade on the country.
Sub part (b):
Explanation of Solution
From the graph, we can easily identify that the
Thus, the increase in the consumer surplus can be calculated by adding these together as follows:
Thus, the consumer surplus increases by $14 million.
Before free trade, the
The total surplus of the economy after the trade increases by the areas of B+C, which means that the total surplus of the economy has increased by $6 million.
Concept introduction:
International trade: It is the trade relation between the countries.
Export: It is the process of selling domestic goods in the international market. Thus, the goods produced in the domestic firms will be sold to other foreign countries. So, it is the outflow of domestic goods and services to the foreign economy.
Import: It is the process of purchasing the foreign-made goods and services by the domestic country. Thus, it is the inflow of foreign goods and services to the domestic economy.
Comparative advantage: It is the ability of the country to produce the goods and services at lower opportunity costs than other countries.
Want to see more full solutions like this?
Chapter 9 Solutions
Principles Of Economics, Ap Edition, 9781337292603, 1337292605, 2018
- Critically analyse the five (5) characteristics of Ubuntu and provide examples of how they apply to the National Health Insurance (NHI) in South Africa.arrow_forwardCritically analyse the five (5) characteristics of Ubuntu and provide examples of how they apply to the National Health Insurance (NHI) in South Africa.arrow_forwardOutline the nine (9) consumer rights as specified in the Consumer Rights Act in South Africa.arrow_forward
- In what ways could you show the attractiveness of Philippines in the form of videos/campaigns to foreign investors? Cite 10 examples.arrow_forwardExplain the following terms and provide an example for each term: • Corruption • Fraud • Briberyarrow_forwardIn what ways could you show the attractiveness of a country in the form of videos/campaigns?arrow_forward

 Principles of Macroeconomics (MindTap Course List)EconomicsISBN:9781285165912Author:N. Gregory MankiwPublisher:Cengage Learning
 Principles of Economics, 7th Edition (MindTap Cou...EconomicsISBN:9781285165875Author:N. Gregory MankiwPublisher:Cengage Learning
 Microeconomics: Private and Public Choice (MindTa...EconomicsISBN:9781305506893Author:James D. Gwartney, Richard L. Stroup, Russell S. Sobel, David A. MacphersonPublisher:Cengage Learning
 Macroeconomics: Private and Public Choice (MindTa...EconomicsISBN:9781305506756Author:James D. Gwartney, Richard L. Stroup, Russell S. Sobel, David A. MacphersonPublisher:Cengage Learning
 Economics: Private and Public Choice (MindTap Cou...EconomicsISBN:9781305506725Author:James D. Gwartney, Richard L. Stroup, Russell S. Sobel, David A. MacphersonPublisher:Cengage Learning


