
1.
Compute the contribution margin per unit and the breakeven point in units for the Flex 1000 panel, before and after the proposed reengineering project.
1.
Explanation of Solution
Compute the contribution margin per unit and the breakeven point in units for the Flex 1000 panel, before and after the proposed reengineering project.
| Particulars | Current | Proposed |
| Selling price per unit | $600.00 | $600.00 |
| Less: Variable costs per unit | ||
| Materials and purchased parts | 180.00 | 195.00 |
| Direct labor | 55.00 | 62.50 |
| Variable | 70.00 | 80.00 |
| Variable GSA per unit | 25.00 | 25.00 |
| Total variable cost per unit | $330.00 | $362.50 |
| Contribution margin per unit (CONTRIBUTION MARGIN) | $270.00 | $237.50 |
|
Total fixed costs per year: | ||
| Fixed manufacturing overhead per unit | $90 | $55 |
| Multiply: Number of units | 380,000 | 380,000 |
| Fixed manufacturing overhead | $34,200,000 | $20,900,000 |
| Fixed General Selling and Administrative costs | $2,050,000 | $2,050,000 |
| Total fixed costs per year (F) | $36,250,000 | $22,950,000 |
| Breakeven in units | 134,260 | 96,632 |
Table (1)
2.
Determine the indifference point in terms of number of sales units between the current manufacturing plan and the proposed plan of Company SF.
2.
Explanation of Solution
Determine the indifference point in terms of number of sales units between the current manufacturing plan and the proposed plan of Company SF.
The cost indifference point is Q. The cost function for the current plan and proposed plan are given below:
From the above calculation, the firm would prefer the low fixed cost strategy at the current level of 380,000 units.
3.
Describe the (a) strategy of Company SF and (b) whether Company SF should undertake the proposed reengineering plan.
3.
Explanation of Solution
(a) The strategy of Company SF can be explained as follows:
The strategy of Company SF is best described as differentiation as the firm has achieved success through the innovation in its product design. Moreover, the firm belongs to an industry where innovation and product design is a key factor for success. The technology used by Company SF is an important strategy that has been challenging for the firms operating in the same industry. Company SF should consider the existence of significant level of risk in the failure of meeting the customer’s expectation. Company SF has to design and implement a strategy that would enhance the innovation of the company in the market and also safeguard the possibility of losses from the failure of technology.
(b) whether the company should select the proposed re-engineering plan:
The calculations in requirement 2 to select the new plan, at the current level of 380,000 units because costs are lower for the new plan, and will continue to be lower for the new plan as long as volume stays below 409,231 units. The 409,231 point of indifference is computed using the information below.
| Particulars | Current | Proposed | Difference |
| Contribution Margin (CONTRIBUTION MARGIN) | $270.00 | $237.50 | $32.50 |
| Fixed Cost (F) | $36,250,000 | $22,950,000 | $13,300,000 |
| Indifference Point | 409,231 units | ||
Table (2)
Strategically, the new plan will be preferred because it is an appropriate response to the firm’s risk, as determined in requirement 1. The reduction in the operating leverage (
Therefore, a strategy that emphasizes less manufacturing and enhances the product design and development would be more reliable.
4.
Prepare a chart (single graph) representing the profit-volume equation for each of the two decision alternatives.
4.
Explanation of Solution
Prepare a chart (single graph) representing the profit-volume equation for each of the two decision alternatives.
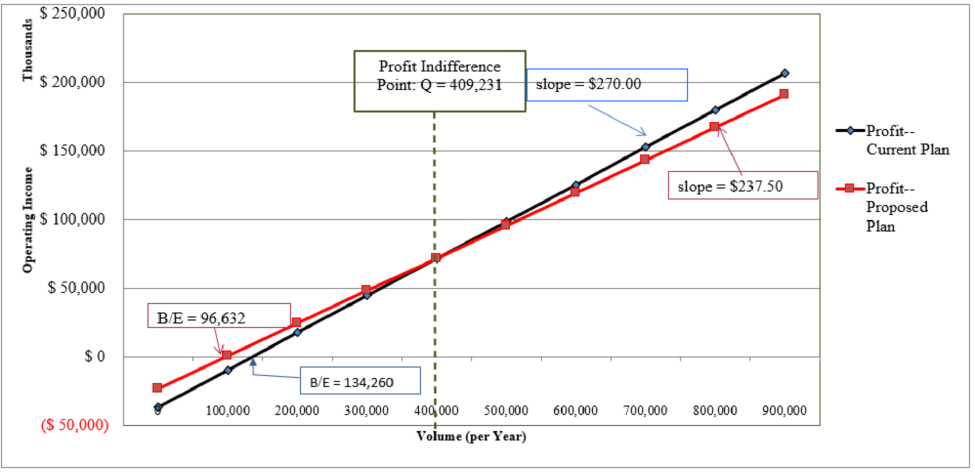
Figure (1)
The chart has been prepared based on the table (1):
| Assumed Levels of Demand | Profit-Current | Profit-Proposed |
| 0 | ($ 36,250,000) | ($ 22,950,000) |
| 100,000 | ($ 9,250,000) | $ 800,000 |
| 200,000 | $ 17,750,000 | $ 24,550,000 |
| 300,000 | $ 44,750,000 | $ 48,300,000 |
| 400,000 | $ 71,750,000 | $ 72,050,000 |
| 500,000 | $ 98,750,000 | $ 95,800,000 |
| 600,000 | $ 125,750,000 | $ 119,550,000 |
| 700,000 | $ 152,750,000 | $ 143,300,000 |
| 800,000 | $ 179,750,000 | $ 167,050,000 |
| 900,000 | $ 206,750,000 | $ 190,800,000 |
Table (3)
Note: The data is computed by using the formula:
5.
Compute and interpret the degree of operating leverage (DOL) for each decision alternative.
5.
Explanation of Solution
Compute the degree of operating leverage (DOL) for each decision alternative.
| Degree of Operating Leverage | |||
| Volume Q | Current | Proposed | |
| 400,000 | 1.51 | 1.32 | |
| 600,000 | 1.29 | 1.19 | |
| DOL components (Current) | |||
| Volume Q | Contribution Margin | Operating income | DOL |
| 400,000 | $108,000,000 | $71,750,000 | 1.51 |
| 600,000 | $162,000,000 | $125,750,000 | 1.29 |
| DOL components (Proposed) | |||
| Volume Q | Contribution Margin | Operating income | |
| 400,000 | $95,000,000 | $72,050,000 | 1.32 |
| 600,000 | $142,500,000 | $119,550,000 | 1.19 |
. Table (4)
Operating leverage refers to the extent to which fixed costs characterize an organization’s cost structure. The greater the fixed costs, the greater the operating leverage and more profits are sensitive to changes in volume of sales.
Degree of Operating leverage (DOL) is the percentage change in operating profit per percentage change in sales. Thus, for the results above, a DOL of 1.51 means that from a volume level (Q) of 400,000 units per year, each percentage change in sales volume under the current production plan would reflect a 1.51% change in operating income. At this same level of Q, the DOL for the proposed plan is 1.32. Therefore, the existing manufacturing plan has more operating leverage, which in turn means that at any output level, Q, the DOL will be higher than the corresponding DOL under the proposed manufacturing plan.
The current plan would generate higher percentage reductions in operating income if sales volume declines as compared to the proposed plan, but greater percentage increases in operating income in response to increases in sales volume.
Want to see more full solutions like this?
Chapter 9 Solutions
COST MANAGEMENT LOOSELEAF CUSTOM

- Please explain the solution to this general accounting problem with accurate principles.arrow_forwardI am searching for the correct answer to this general accounting problem with proper accounting rules.arrow_forwardi will give unhelpful.blurr image please comment i will write values. please dont Solve with incorrect values otherwise unhelpful.arrow_forward
- Please provide the accurate answer to this general accounting problem using valid techniques.arrow_forwardCompute the total cost of the Graphico order.arrow_forwardCobalt Corporation applies overhead based on direct labor cost. Estimated overhead and direct labor costs for the year were $98,200 and $112,000, respectively. During the year, actual overhead was $94,300, and actual direct labor cost was $108,000. The entry to close the over- or underapplied overhead at year-end, assuming an immaterial amount, would include: A. a debit to Cost of Goods Sold for $300.40 B. a credit to Cost of Goods Sold for $ $394.40 C. a credit to Finished Goods Inventory for 398.80 D. a debit to Work in Process Inventory for 410.00 E. a credit to Factory Overhead for $361.75arrow_forward

 AccountingAccountingISBN:9781337272094Author:WARREN, Carl S., Reeve, James M., Duchac, Jonathan E.Publisher:Cengage Learning,
 Accounting Information SystemsAccountingISBN:9781337619202Author:Hall, James A.Publisher:Cengage Learning,
 Horngren's Cost Accounting: A Managerial Emphasis...AccountingISBN:9780134475585Author:Srikant M. Datar, Madhav V. RajanPublisher:PEARSON
 Intermediate AccountingAccountingISBN:9781259722660Author:J. David Spiceland, Mark W. Nelson, Wayne M ThomasPublisher:McGraw-Hill Education
 Financial and Managerial AccountingAccountingISBN:9781259726705Author:John J Wild, Ken W. Shaw, Barbara Chiappetta Fundamental Accounting PrinciplesPublisher:McGraw-Hill Education