
the table given and calculate the asked questions.
Concept Introduction:
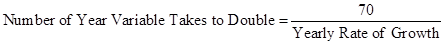
Rule of 70: It is a numerical formula to determine the time period, that a variable will take to double itself.
Formula to calculate number of years variable will take to double itself:

Here:
- R is current constant growth rate.
- N is number of year it will take to be double.
Answer to Problem 3P
a. Ratio of per capita GDP in 2012.
i. Middle-income to high-income countries.
Given,
Real GDP of middle-income country in 2015 is $4,584.
Real GDP of high-income country in 2015 is $41,038.
Formula to calculate ratio of per capita GDP of middle-income country to high-income country,
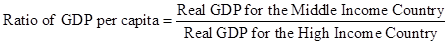
Substitute $4,584 for real GDP for the middle-income country and $41,038 for real GDP for the high-income country.
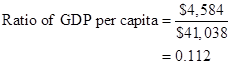
In the given case, ratio of per capita GDP of middle-income country to high-income country is 0.112.
ii. Low-income to high-income countries.
Given,
Real GDP of low-income country in 2015 is $588.
Real GDP of high-income country 2015 is $41,038.
Formula to calculate ratio of per capita GDP of low-income country to high-income country,

Substitute $588 for real GDP for the low-income country and $41,038 for real GDP for the high-income country.
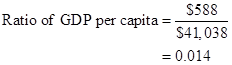
In the given case, ratio of per capita GDP of low-income country to high-income country is 0.014.
iii. Low-income to middle-income countries.
Given:
Real GDP of low-income country in 2015 is $588.
Real GDP of middle-income country in 2015 is $4,584.
Formula to calculate ratio of per capita GDP of low-income country to middle-income country,

Substitute $588 for real GDP for the low-income country and $4,584 for real GDP for the middle-income country.
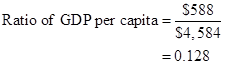
In the given case, ratio of per capita GDP of low-income country to middle-income country is 0.128.
b. Number of years taken by the low income and middle-income countries to double their per capita GDP.
Given,
Growth rate of low-income country is 2.3%.
Growth rate of middle-income country is 4.4%.
Formula to calculate number of year variable takes to double,
 (I)
(I) According to the given case, to double GDP the low-income country and middle-income country will take 30 years and 16 years respectively.
Number of years taken by low-income country to double its GDP.
Substitute 2.3 for yearly rate of growth in (I).
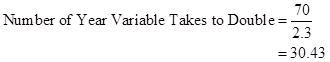
Therefore, to double GDP the low-income country will take 30 years.
Number of years taken by middle-income country to double its GDP.
Substitute 4.4 for yearly rate of growth in (I).
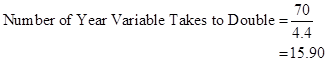
Therefore, to double GDP the middle-income country will take 16 years.
c. Per capita GDP of each of the regions in 2085.
Given,
Growth rate of high-income country is 1.0%.
Growth rate of low-income country is 2.3%.
Growth rate of middle-income country is 4.4%.
Formula to calculate number of year variable takes to double,

Substitute 1.0 for yearly rate of growth in (I).
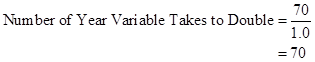
- Therefore, in 70 years, which will be in 2085, GDP per capita of high-income countries will be $82,076

- If per capita GDP is to be projected then middle-income country will double its per capita GDP by 4 times
 Therefore, in 2085 per capita GDP of middle-income country will be $73,344
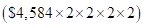
- If per capita GDP is to be projected then low-income country, will double its per capita GDP by 2 times
 Therefore, in 2085 per capita GDP of low-income country will be $2,352
d. Projected per capita GDP in 2085.
Calculated (in part c. ),
Real GDP of low-income country in 2085 is $2,352.
Real GDP of middle-income country in 2085 is $73,344.
Real GDP of high-income country in 2085 is $82,076.
Middle-income to high-income countries.
Formula to calculate ratio of per capita GDP of middle-income country to high-income country,

Substitute $73,344. for real GDP for the middle-income country and $82,076 for real GDP for the high-income country.
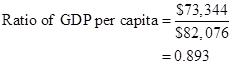
Thus, ratio of per capita GDP of middle-income country to high-income country is 0.893.
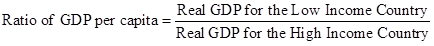
Low-income to high-income countries.
Formula to calculate ratio of per capita GDP of low-income country to high-income country,
Substitute $2,352 for real GDP for the low-income country and $82,076 for real GDP for the high-income country.
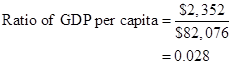
Thus, ratio of per capita GDP of low-income country to high-income country is 0.028.
Low-income to middle-income countries.
Formula to calculate ratio of per capita GDP of low-income country to middle-income country,
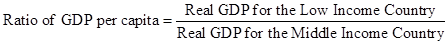
Substitute $2,352 for real GDP for the low-income country and $73,344 for real GDP for the middle-income country.
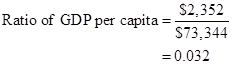
Thus, ratio of per capita GDP of low-income country to middle-income country is 0.032.
e. Comparison of part a. and part d.
According to the data calculated in the above parts the inequality between low-income countries and middle-income countries will increase with time.
Explanation of Solution
- According to the calculated data, per capita GDP of low-income country and middle-income country have improved but per capita GDP of high-income country has not improved that much.
- According to the calculated data, the growth middle-income countries are so fast that its growth in 2085 will surpass the present high-income countries growth.
- The middle-income is growing at much faster rate as compared to low-income countries. Therefore, the inequality between low-income countries and middle-income countries will increase.
Want to see more full solutions like this?
Chapter 9 Solutions
MACROECONOMICS W/ ACHEIVE ACCESS LL

- Problem 3-ABC Challenges: Attrition, Balance and ComplianceCan television inform people about public affairs? Political scientists Bethany Albertson and Adria Lawrence (2009) conducted an experiment in which they randomly assigned people to treatment and control groups to evaluate the effect of watching TV on a person’s information level. Those assigned to the treatment group were told to watch a specific television broadcast and were later asked questions related to what they watched. Those in the controlgroup were not shown the TV broadcast but were asked questions related to the material in the TV broadcast. The dataset contains the following variables: : Dummy variable which =1 if a person reads news and 0 otherwise. : interest in political affairs (not interested=1 to very interested=4) : years of education : female dummy variable (female=1; male=0) : family income in thousands of dollars : information level (low information level=1 to high information level=4) =1 if the…arrow_forwardProblem 2-Experiments/Randomized Control Trial Suppose you are interested in studying the effect of academic counselling on the years it takes for a student to obtain an undergraduate degree. You conduct a randomized control trial to answer the question. You randomly assign 2500 individuals in a university in New York to receive academic counselling and 2500 students to not receive any academic counselling. a. Which people are a part of the treatment group and which people are a part of thecontrol group? b. What regression will you run? Define the variables where required. c. Suppose you estimate = -0.3. Interpret it. d. You test for balance using the variables mentioned in the table below. Based on the results do you think that the treatment and control group are balanced? If your answer is “yes” then explain why. If your answer is “no”, then explain why and mention how will you address the issue of imbalance. e. Suppose that some unmotivated students in the control group decided to…arrow_forwardHow to calculate total cost?arrow_forward
- Problem 1-Experiments/Randomized Control TrialSuppose you are interested in studying the effect of being a part of the labor union on anindividual’s hourly wage.You collect data on 1000 people and run the following regression. where is a dummy variable which is equal t to 1 for people who are a part of labor union and0 for others. a. Suppose you estimate . Interpret b. Do you think is biased or unbiased? Explain. Now suppose you conduct a randomized control trial to answer the same question. Yourandomly assign some individuals to be a part of the labor union and others to not be a partof the labor union. The first step you take is to ensure that the randomization was donecorrectly. Then you estimate the following equation: =1 if the student is assigned to be a part of Labor Union=0 if the student is assigned to not be a part of Labor Union c. Why is it important to ensure that the randomization is done correctly? d. Name any two variables that you can use to test if Treatment and…arrow_forwardWhat is kiosk?arrow_forwardIf food is produced in the U.S., sold in the U.S. and consumed in the U.S., a reduction in its price will have which of the following effects ______? Two of the answers are correct. The consumer price index will decrease. None of the answers are correct. The GDP deflator will decrease.arrow_forward
- how to caculate verible cost?arrow_forwardWhat is the deficit?arrow_forwardIdentify the two curves shown on the graph, and explain their upward and downward slopes. Why does curve Aintersect the horizontal axis? What is the significance of quantity d? What does erepresent? How would the optimal quantity of information change if the marginal benefit of information increased—that is, if the marginal benefit curve shifted upward?arrow_forward

 Principles of Economics (12th Edition)EconomicsISBN:9780134078779Author:Karl E. Case, Ray C. Fair, Sharon E. OsterPublisher:PEARSON
 Engineering Economy (17th Edition)EconomicsISBN:9780134870069Author:William G. Sullivan, Elin M. Wicks, C. Patrick KoellingPublisher:PEARSON
 Principles of Economics (MindTap Course List)EconomicsISBN:9781305585126Author:N. Gregory MankiwPublisher:Cengage Learning
 Managerial Economics: A Problem Solving ApproachEconomicsISBN:9781337106665Author:Luke M. Froeb, Brian T. McCann, Michael R. Ward, Mike ShorPublisher:Cengage Learning
 Managerial Economics & Business Strategy (Mcgraw-...EconomicsISBN:9781259290619Author:Michael Baye, Jeff PrincePublisher:McGraw-Hill Education