
the table given and calculate the asked questions.
Concept Introduction:
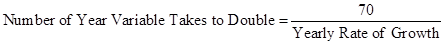
Rule of 70: It is a numerical formula to determine the time period, that a variable will take to double itself.
Formula to calculate number of years variable will take to double itself:

Here:
- R is current constant growth rate.
- N is number of year it will take to be double.
Answer to Problem 3P
a. Ratio of per capita GDP in 2012.
i. Middle-income to high-income countries.
Given,
Real GDP of middle-income country in 2015 is $4,584.
Real GDP of high-income country in 2015 is $41,038.
Formula to calculate ratio of per capita GDP of middle-income country to high-income country,
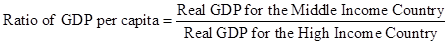
Substitute $4,584 for real GDP for the middle-income country and $41,038 for real GDP for the high-income country.
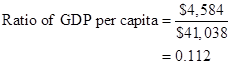
In the given case, ratio of per capita GDP of middle-income country to high-income country is 0.112.
ii. Low-income to high-income countries.
Given,
Real GDP of low-income country in 2015 is $588.
Real GDP of high-income country 2015 is $41,038.
Formula to calculate ratio of per capita GDP of low-income country to high-income country,

Substitute $588 for real GDP for the low-income country and $41,038 for real GDP for the high-income country.
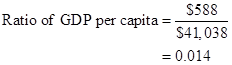
In the given case, ratio of per capita GDP of low-income country to high-income country is 0.014.
iii. Low-income to middle-income countries.
Given:
Real GDP of low-income country in 2015 is $588.
Real GDP of middle-income country in 2015 is $4,584.
Formula to calculate ratio of per capita GDP of low-income country to middle-income country,

Substitute $588 for real GDP for the low-income country and $4,584 for real GDP for the middle-income country.
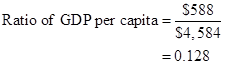
In the given case, ratio of per capita GDP of low-income country to middle-income country is 0.128.
b. Number of years taken by the low income and middle-income countries to double their per capita GDP.
Given,
Growth rate of low-income country is 2.3%.
Growth rate of middle-income country is 4.4%.
Formula to calculate number of year variable takes to double,
 (I)
(I) According to the given case, to double GDP the low-income country and middle-income country will take 30 years and 16 years respectively.
Number of years taken by low-income country to double its GDP.
Substitute 2.3 for yearly rate of growth in (I).
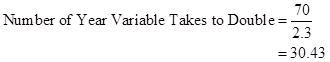
Therefore, to double GDP the low-income country will take 30 years.
Number of years taken by middle-income country to double its GDP.
Substitute 4.4 for yearly rate of growth in (I).
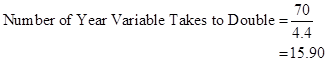
Therefore, to double GDP the middle-income country will take 16 years.
c. Per capita GDP of each of the regions in 2085.
Given,
Growth rate of high-income country is 1.0%.
Growth rate of low-income country is 2.3%.
Growth rate of middle-income country is 4.4%.
Formula to calculate number of year variable takes to double,

Substitute 1.0 for yearly rate of growth in (I).
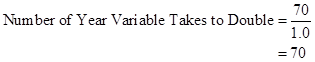
- Therefore, in 70 years, which will be in 2085, GDP per capita of high-income countries will be $82,076

- If per capita GDP is to be projected then middle-income country will double its per capita GDP by 4 times
 Therefore, in 2085 per capita GDP of middle-income country will be $73,344
- If per capita GDP is to be projected then low-income country, will double its per capita GDP by 2 times
 Therefore, in 2085 per capita GDP of low-income country will be $2,352
d. Projected per capita GDP in 2085.
Calculated (in part c. ),
Real GDP of low-income country in 2085 is $2,352.
Real GDP of middle-income country in 2085 is $73,344.
Real GDP of high-income country in 2085 is $82,076.
Middle-income to high-income countries.
Formula to calculate ratio of per capita GDP of middle-income country to high-income country,

Substitute $73,344. for real GDP for the middle-income country and $82,076 for real GDP for the high-income country.
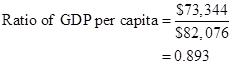
Thus, ratio of per capita GDP of middle-income country to high-income country is 0.893.
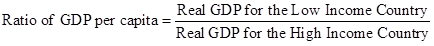
Low-income to high-income countries.
Formula to calculate ratio of per capita GDP of low-income country to high-income country,
Substitute $2,352 for real GDP for the low-income country and $82,076 for real GDP for the high-income country.
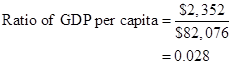
Thus, ratio of per capita GDP of low-income country to high-income country is 0.028.
Low-income to middle-income countries.
Formula to calculate ratio of per capita GDP of low-income country to middle-income country,
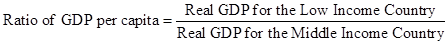
Substitute $2,352 for real GDP for the low-income country and $73,344 for real GDP for the middle-income country.
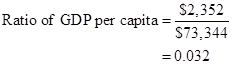
Thus, ratio of per capita GDP of low-income country to middle-income country is 0.032.
e. Comparison of part a. and part d.
According to the data calculated in the above parts the inequality between low-income countries and middle-income countries will increase with time.
Explanation of Solution
- According to the calculated data, per capita GDP of low-income country and middle-income country have improved but per capita GDP of high-income country has not improved that much.
- According to the calculated data, the growth middle-income countries are so fast that its growth in 2085 will surpass the present high-income countries growth.
- The middle-income is growing at much faster rate as compared to low-income countries. Therefore, the inequality between low-income countries and middle-income countries will increase.
Want to see more full solutions like this?
Chapter 9 Solutions
MACROECONOMICS IN MODULES

- Exercise 4A firm has the following average cost: AC = 200 + 2Q – 36 Q Find the stationary point and determine if it is a maximum or a minimum.b. Find the marginal cost function.arrow_forwardExercise 4A firm has the following average cost: AC = 200 + 2Q – 36 Q Find the stationary point and determine if it is a maximum or a minimum.b. Find the marginal cost function.arrow_forwardExercise 2A firm has the following short-run production function: Q = 30L2 -0.5L3a. Make a table with two columns: Production and Labour b. Add a third column to the table with the marginal product of labour c. Graph the values that you estimated for the production function and the marginal product oflabour Exercise 3A Firm has the following production function: Q= 20L-0.4L2a. Using differential calculus find the unit of labour that maximizes the production. b. Estimate function of Marginal product of labor c. Obtain the Average product of labor. d. Find the point at which the Marginal Product of Labour is equal to the Average Product of Labour.arrow_forward
- Problem 3 You have the following data for the last 12 months' sales for the PRQ Corporation (in thousands of dollars): January 500 July 610 February 520 August 620 March 520 September 580 April 510 October 550 May 530 November 510 June 580 December 480 1. Calculate a 3-month centered moving average. 2. Use this moving average to forecast sales for January of next year. 3. If you were asked to forecast January and February sales for next year, would you be confident of your forecast using the preceding moving averages? Why or why not? expect? Explain.arrow_forwardProblem 5 The MNO Corporation is preparing for its stockholder meeting on May 15, 2013. It sent out proxies to its stockholders on March 15 and asked stockholders who plan to attend the meeting to respond. To plan for a sufficient number of information packages to be distributed at the meeting, as well as for refreshments to be served, the company has asked you to forecast the number of attending stockholders. By April 15, 378 stockholders have expressed their intention to attend. You have available the following data for the last 6 years for total attendance at the stockholder meeting and the number of positive responses as of April 15: Year Positive Responses Attendance 2007 322 520 2008 301 550 2009 398 570 2010 421 600 2011 357 570 2012 452 650 1. What is your attendance forecast for the 2013 stockholder meeting? 2. Are there any other factors that could affect attendance, and thus make your forecast inac- curate?arrow_forwardProblem 4 Office Enterprises (OE) produces a line of metal office file cabinets. The company's economist, having investigated a large number of past data, has established the following equation of demand for these cabinets: Q=10,000+6013-100P+50C Q=Annual number of cabinets sold B = Index of nonresidential construction P = Average price per cabinet charged by OE C=Average price per cabinet charged by OE's closest competitor It is expected that next year's nonresidential construction index will stand at 160, OE's average price will be $40, and the competitor's average price will be $35. 1. Forecast next year's sales. 2. What will be the effect if the competitor lowers its price to 832? If it raises its price to $36? 3. What will happen if OE reacts to the decrease mentioned in part b by lowering its price to $37? 4. If the index forecast was wrong, and it turns out to be only 140 next year, what will be the effect on OE's sales? If not, what does it measure?arrow_forward
- Name: Problem 1: Managerial Economics, Assignment 5 April 20, 2025 If the sales of your company have grown from $500,000 five years ago to $1,050,150 this year, what is the compound growth rate? If you expect your sales to grow at a rate of 10 percent for the next five years, what should they be five years from now?arrow_forward1. In this question, assume all dollar units are real dollars in billions. For example, $100 means $100 billion. Argentina thinks it can find $105 of domestic investment projects with a marginal product of capital (MPK) equal to 10% (each $1 invested in year 0 pays off $0.10 in every later year). Assume a world real interest rate r*is 5%, and initial external wealth W (W in year -1) is 0. a. You find that the formula on the lecture slide: > r*, which means that a country will ΔΟ AK take on investment projects as long as the marginal product of capital (MPK) is at least as high as the real interest rate. Using this formula, answer if Argentina should conduct the project. b. If the projects are not done, GDP = Q = C = $200 in all years. Compute the present value of Q and C. c. If Argentina conducts the projects (investing $105), what is the present value of Q and C? d. If Argentina conducts the projects, what is the present value of C? Is Argentina better off with the investment?arrow_forward2. Consider a world of two countries: Highland (H) and Lowland (L). Each country has an average output of 9 and desires to smooth consumption. All income takes the form of capital income and is fully consumed each period. Initially, there are two states of the world: Pandemic (P) and Flood (F) each occurring with 50% probability. Pandemic affects Highland and lowers the output there to 8, leaving Lowland unaffected with an output of 10. Flood affects Lowland and lowers the output there to 8, leaving Highland unaffected with an output of 10. a. Assume that households in each country own the entire capital stock of their own land. Fill in the numbers on the following table. Pandemic Highland's income Lowland's income Flood Variation about the mean b. Assume that each country owns 50% of the other country's capital. Fill in the numbers on the following table. Pandemic Flood Variation about the mean Highland's income Lowland's income c. Compare your answer to (a) and (b). Does…arrow_forward
- 3. This question explores IS and FX equilibria in a numerical example. a. The consumption function is C = 1.5 + 0.8(Y - T). What is the marginal propensity to consume (MPC)? What is the marginal propensity to save (MPS)? b. The trade balance is TB = 5 [1-()] - (0.2(Y-8). What is the marginal propensity to consume foreign goods (MPCF)? What is the marginal propensity to consume home goods(MPCH)? c. The investment function is I = 3 - 10i. What is investment when the interest rate is equal to 0.10=10%. d. Assume government spending is G. Add up the four components of demand and write down the expression for D. Make sure that you simplify the equation. e. Derive the equation for the good market equilibrium using Y = D.arrow_forward1. A firm has the following demand function: P = 60 – 0.5Q and its total cost is defined by TC= 13+ Qa. Find the maximum revenue b. Find the production to optimize the profit. c. Verify if the marginal revenue and marginal cost are the same at the profit-maximizing productionlevel. Exercise 6From the point of view of the firm, what decision criteria have been found relevant in the analysis ofproduction and profit? Provide two refernces with your answer.arrow_forward5. Some people find options expensive and use more complex structures to reduce the cost. For example, consider buying a call with a strike of $55 and selling a call with a strike of $60. a. What is the cost of establishing this combined position? b. What is the payoff of the combined position if the market price goes to $60? c. What is the payoff of the combined position if the market price goes to $100?arrow_forward

 Principles of Economics (12th Edition)EconomicsISBN:9780134078779Author:Karl E. Case, Ray C. Fair, Sharon E. OsterPublisher:PEARSON
 Engineering Economy (17th Edition)EconomicsISBN:9780134870069Author:William G. Sullivan, Elin M. Wicks, C. Patrick KoellingPublisher:PEARSON
 Principles of Economics (MindTap Course List)EconomicsISBN:9781305585126Author:N. Gregory MankiwPublisher:Cengage Learning
 Managerial Economics: A Problem Solving ApproachEconomicsISBN:9781337106665Author:Luke M. Froeb, Brian T. McCann, Michael R. Ward, Mike ShorPublisher:Cengage Learning
 Managerial Economics & Business Strategy (Mcgraw-...EconomicsISBN:9781259290619Author:Michael Baye, Jeff PrincePublisher:McGraw-Hill Education