
the table given and calculate the asked questions.
Concept Introduction:
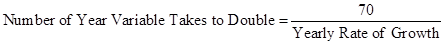
Rule of 70: It is a numerical formula to determine the time period, that a variable will take to double itself.
Formula to calculate number of years variable will take to double itself:

Here:
- R is current constant growth rate.
- N is number of year it will take to be double.
Answer to Problem 3P
a. Ratio of per capita GDP in 2012.
i. Middle-income to high-income countries.
Given,
Real GDP of middle-income country in 2015 is $4,584.
Real GDP of high-income country in 2015 is $41,038.
Formula to calculate ratio of per capita GDP of middle-income country to high-income country,
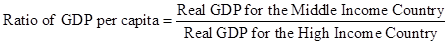
Substitute $4,584 for real GDP for the middle-income country and $41,038 for real GDP for the high-income country.
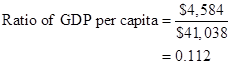
In the given case, ratio of per capita GDP of middle-income country to high-income country is 0.112.
ii. Low-income to high-income countries.
Given,
Real GDP of low-income country in 2015 is $588.
Real GDP of high-income country 2015 is $41,038.
Formula to calculate ratio of per capita GDP of low-income country to high-income country,

Substitute $588 for real GDP for the low-income country and $41,038 for real GDP for the high-income country.
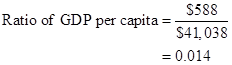
In the given case, ratio of per capita GDP of low-income country to high-income country is 0.014.
iii. Low-income to middle-income countries.
Given:
Real GDP of low-income country in 2015 is $588.
Real GDP of middle-income country in 2015 is $4,584.
Formula to calculate ratio of per capita GDP of low-income country to middle-income country,

Substitute $588 for real GDP for the low-income country and $4,584 for real GDP for the middle-income country.
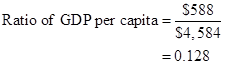
In the given case, ratio of per capita GDP of low-income country to middle-income country is 0.128.
b. Number of years taken by the low income and middle-income countries to double their per capita GDP.
Given,
Growth rate of low-income country is 2.3%.
Growth rate of middle-income country is 4.4%.
Formula to calculate number of year variable takes to double,
 (I)
(I) According to the given case, to double GDP the low-income country and middle-income country will take 30 years and 16 years respectively.
Number of years taken by low-income country to double its GDP.
Substitute 2.3 for yearly rate of growth in (I).
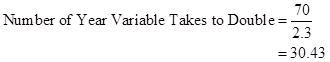
Therefore, to double GDP the low-income country will take 30 years.
Number of years taken by middle-income country to double its GDP.
Substitute 4.4 for yearly rate of growth in (I).
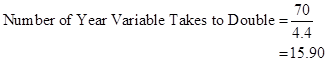
Therefore, to double GDP the middle-income country will take 16 years.
c. Per capita GDP of each of the regions in 2085.
Given,
Growth rate of high-income country is 1.0%.
Growth rate of low-income country is 2.3%.
Growth rate of middle-income country is 4.4%.
Formula to calculate number of year variable takes to double,

Substitute 1.0 for yearly rate of growth in (I).
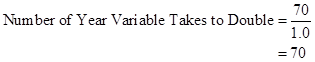
- Therefore, in 70 years, which will be in 2085, GDP per capita of high-income countries will be $82,076

- If per capita GDP is to be projected then middle-income country will double its per capita GDP by 4 times
 Therefore, in 2085 per capita GDP of middle-income country will be $73,344
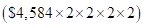
- If per capita GDP is to be projected then low-income country, will double its per capita GDP by 2 times
 Therefore, in 2085 per capita GDP of low-income country will be $2,352
d. Projected per capita GDP in 2085.
Calculated (in part c. ),
Real GDP of low-income country in 2085 is $2,352.
Real GDP of middle-income country in 2085 is $73,344.
Real GDP of high-income country in 2085 is $82,076.
Middle-income to high-income countries.
Formula to calculate ratio of per capita GDP of middle-income country to high-income country,

Substitute $73,344. for real GDP for the middle-income country and $82,076 for real GDP for the high-income country.
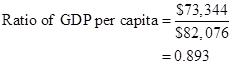
Thus, ratio of per capita GDP of middle-income country to high-income country is 0.893.
Low-income to high-income countries.
Formula to calculate ratio of per capita GDP of low-income country to high-income country,
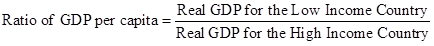
Substitute $2,352 for real GDP for the low-income country and $82,076 for real GDP for the high-income country.
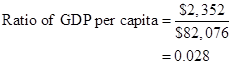
Thus, ratio of per capita GDP of low-income country to high-income country is 0.028.
Low-income to middle-income countries.
Formula to calculate ratio of per capita GDP of low-income country to middle-income country,
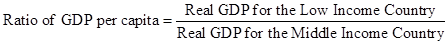
Substitute $2,352 for real GDP for the low-income country and $73,344 for real GDP for the middle-income country.
Thus, ratio of per capita GDP of low-income country to middle-income country is 0.032.
e. Comparison of part a. and part d.
According to the data calculated in the above parts the inequality between low-income countries and middle-income countries will increase with time.
Explanation of Solution
- According to the calculated data, per capita GDP of low-income country and middle-income country have improved but per capita GDP of high-income country has not improved that much.
- According to the calculated data, the growth middle-income countries are so fast that its growth in 2085 will surpass the present high-income countries growth.
- The middle-income is growing at much faster rate as compared to low-income countries. Therefore, the inequality between low-income countries and middle-income countries will increase.
Want to see more full solutions like this?

- Published in 1980, the book Free to Choose discusses how economists Milton Friedman and Rose Friedman proposed a one-sided view of the benefits of a voucher system. However, there are other economists who disagree about the potential effects of a voucher system.arrow_forwardThe following diagram illustrates the demand and marginal revenue curves facing a monopoly in an industry with no economies or diseconomies of scale. In the short and long run, MC = ATC. a. Calculate the values of profit, consumer surplus, and deadweight loss, and illustrate these on the graph. b. Repeat the calculations in part a, but now assume the monopoly is able to practice perfect price discrimination.arrow_forwardThe projects under the 'Build, Build, Build' program: how these projects improve connectivity and ease of doing business in the Philippines?arrow_forward
- Critically analyse the five (5) characteristics of Ubuntu and provide examples of how they apply to the National Health Insurance (NHI) in South Africa.arrow_forwardCritically analyse the five (5) characteristics of Ubuntu and provide examples of how they apply to the National Health Insurance (NHI) in South Africa.arrow_forwardOutline the nine (9) consumer rights as specified in the Consumer Rights Act in South Africa.arrow_forward

 Principles of Economics (12th Edition)EconomicsISBN:9780134078779Author:Karl E. Case, Ray C. Fair, Sharon E. OsterPublisher:PEARSON
 Engineering Economy (17th Edition)EconomicsISBN:9780134870069Author:William G. Sullivan, Elin M. Wicks, C. Patrick KoellingPublisher:PEARSON
 Principles of Economics (MindTap Course List)EconomicsISBN:9781305585126Author:N. Gregory MankiwPublisher:Cengage Learning
 Managerial Economics: A Problem Solving ApproachEconomicsISBN:9781337106665Author:Luke M. Froeb, Brian T. McCann, Michael R. Ward, Mike ShorPublisher:Cengage Learning
 Managerial Economics & Business Strategy (Mcgraw-...EconomicsISBN:9781259290619Author:Michael Baye, Jeff PrincePublisher:McGraw-Hill Education