
Concept explainers
Videos
1.
Find the test statistic value and make a decision to retain or reject the null hypothesis
1.
Answer to Problem 20CAP
The test statistic value is 3.
The decision is to reject the null hypothesis.
Explanation of Solution
Calculation:
Let
A sample of 10 participants observed one of two comedians is considered and they are rated 7-point scale from 1 (not likable at all) to 7 (very likable). The claim is the there is difference between the likability ratings of two groups. This represents the alternative hypothesis. The level of significance is 0.05.
Null hypothesis:
That is, there is no difference between the likability ratings of two groups.
Alternative hypothesis:
That is, there is difference between the likability ratings of two groups.
The degrees of freedom for t distribution is,
The test is two tailed, the degrees of freedom are 8, and the alpha level is 0.05.
From the Appendix C: Table C.2 the t Distribution:
- Locate the value 8 in the degrees of freedom (df) column.
- Locate the 0.05 in the proportion in Two tails combined row.
- The intersecting value that corresponds to the 8 with level of significance 0.05 is 2.306.
Decision rules:
- If the test statistic value is greater than the critical value, then reject the null hypothesis or else retain the null hypothesis.
- If the negative test statistic value is less than negative critical value, then reject the null hypothesis or else retain the null hypothesis.
The formula of test statistic for one-sample t test is,
In the formula,
In the formula,
Software procedure:
Step by step procedure to obtain test statistic value using SPSS software is given as,
- Choose Variable view.
- Under the name, enter the names as Ratings, and Comedians.
- Choose Data view, enter the data.
- Choose Analyze>Compare means>Independent Samples T Test.
- In Test variables, enter the column as Ratings.
- In Grouping variables, enter the column as Comedians.
- Select Define Groups; enter Group 1 as 1 and Group 2 as 2.
- Click OK.
Output using SPSS software is given below:
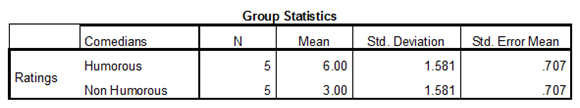
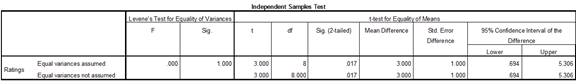
Thus, the test statistic value is 3.
Justification: The value of test statistic is 3 and critical value is 2.306. The test statistic value is greater than the critical value. The test statistic value fall under critical region and hence the null hypothesis is rejected.
2.
Find the value of estimated Cohen’s d to compute the effect size.
2.
Answer to Problem 20CAP
The value of estimated Cohen’s d is 1.90.
There is large effect size.
Explanation of Solution
Cohen’s d:
The Cohen’s d is the measure to estimate the effect size which is used most frequently for t test. In t test the value of population standard deviation is not known, hence this value is replaced with sample standard deviation for estimation the effect size as,
The Cohen’s d for a two-independent-sample t test is,
The description of effect size using Cohen’s d:
- If value of Cohen’s d is less than 0.2, then effect size is small.
- If value of Cohen’s d is in between 0.2 and 0.8, then effect size is medium.
- If value of Cohen’s d is greater than 0.8, then effect size is large.
Calculation:
From the SPSS output, the value of
The value of estimated Cohen’s d is 1.90. This value is greater than 0.8. Hence the estimated Cohen’s d has a large effect size.
Want to see more full solutions like this?
Chapter 9 Solutions
STAT. FOR BEHAVIORAL SCIENCES WEBASSIGN


- A company found that the daily sales revenue of its flagship product follows a normal distribution with a mean of $4500 and a standard deviation of $450. The company defines a "high-sales day" that is, any day with sales exceeding $4800. please provide a step by step on how to get the answers in excel Q: What percentage of days can the company expect to have "high-sales days" or sales greater than $4800? Q: What is the sales revenue threshold for the bottom 10% of days? (please note that 10% refers to the probability/area under bell curve towards the lower tail of bell curve) Provide answers in the yellow cellsarrow_forwardFind the critical value for a left-tailed test using the F distribution with a 0.025, degrees of freedom in the numerator=12, and degrees of freedom in the denominator = 50. A portion of the table of critical values of the F-distribution is provided. Click the icon to view the partial table of critical values of the F-distribution. What is the critical value? (Round to two decimal places as needed.)arrow_forwardA retail store manager claims that the average daily sales of the store are $1,500. You aim to test whether the actual average daily sales differ significantly from this claimed value. You can provide your answer by inserting a text box and the answer must include: Null hypothesis, Alternative hypothesis, Show answer (output table/summary table), and Conclusion based on the P value. Showing the calculation is a must. If calculation is missing,so please provide a step by step on the answers Numerical answers in the yellow cellsarrow_forward
 MATLAB: An Introduction with ApplicationsStatisticsISBN:9781119256830Author:Amos GilatPublisher:John Wiley & Sons Inc
 Probability and Statistics for Engineering and th...StatisticsISBN:9781305251809Author:Jay L. DevorePublisher:Cengage Learning
 Statistics for The Behavioral Sciences (MindTap C...StatisticsISBN:9781305504912Author:Frederick J Gravetter, Larry B. WallnauPublisher:Cengage Learning
 Elementary Statistics: Picturing the World (7th E...StatisticsISBN:9780134683416Author:Ron Larson, Betsy FarberPublisher:PEARSON
 The Basic Practice of StatisticsStatisticsISBN:9781319042578Author:David S. Moore, William I. Notz, Michael A. FlignerPublisher:W. H. Freeman
 Introduction to the Practice of StatisticsStatisticsISBN:9781319013387Author:David S. Moore, George P. McCabe, Bruce A. CraigPublisher:W. H. Freeman