
Videos
In a study, 28 adults with mild periodontal disease are assessed before and 6 months after implementation of a dental-education program intended to promote better oral hygiene. After 6 months, periodontal status improved in 15 patients, declined in 8, and remained the same in 5.
Assess the impact of the program statistically (use a two-sided test)
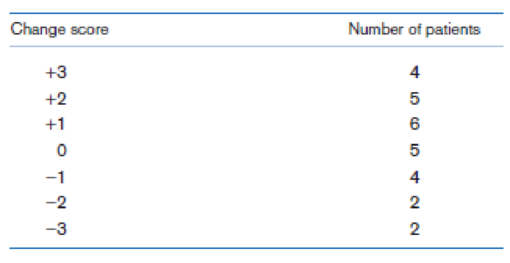
Suppose patients are graded on the degree of change in periodontal status on a 7-point scale, with +3 indicating the greatest improvement, 0 indicating no change, and −3 indicating the greatest decline. The data are given in Table 9.9.
Table 9.9 Degree of change in periodontal status
Illustrate the impact of the program statistically.
Explanation of Solution
From the given information, the degree of change in periodontal status before and after the oral dental- education program is given. The scores are given on a 7 point scale with +3 indicate greatest improvement, 0 indicate no improvement and -3 indicate the greatest decline.
It is appropriate to use sign test.
Null hypothesis:
H0: The impact of program is not statistically significant.
Alternative hypothesis:
H1: The impact pf program is statistically significant.
Thus, C = 15 and n =15+8 = 23.
Calculation:
There are 15 positive and 8 negative scores. Since 23 > 20, the normal theory test can be used. The rejection region is given as
Where,
Here n = 23 and
Substitute the values in the above formula
Thus, the rejection region is
Thus, it can be concluded that patients does not significantly changes on the program. It can be assumed that the periodontal status of patients will remain unchanged in the absence of program, which is a questionable assumption. It is appropriate to use a study design of comparing two groups with a control group over 6 months who did not receive the education program.
Want to see more full solutions like this?
Chapter 9 Solutions
EBK FUNDAMENTALS OF BIOSTATISTICS


- A company found that the daily sales revenue of its flagship product follows a normal distribution with a mean of $4500 and a standard deviation of $450. The company defines a "high-sales day" that is, any day with sales exceeding $4800. please provide a step by step on how to get the answers in excel Q: What percentage of days can the company expect to have "high-sales days" or sales greater than $4800? Q: What is the sales revenue threshold for the bottom 10% of days? (please note that 10% refers to the probability/area under bell curve towards the lower tail of bell curve) Provide answers in the yellow cellsarrow_forwardFind the critical value for a left-tailed test using the F distribution with a 0.025, degrees of freedom in the numerator=12, and degrees of freedom in the denominator = 50. A portion of the table of critical values of the F-distribution is provided. Click the icon to view the partial table of critical values of the F-distribution. What is the critical value? (Round to two decimal places as needed.)arrow_forwardA retail store manager claims that the average daily sales of the store are $1,500. You aim to test whether the actual average daily sales differ significantly from this claimed value. You can provide your answer by inserting a text box and the answer must include: Null hypothesis, Alternative hypothesis, Show answer (output table/summary table), and Conclusion based on the P value. Showing the calculation is a must. If calculation is missing,so please provide a step by step on the answers Numerical answers in the yellow cellsarrow_forward
 Glencoe Algebra 1, Student Edition, 9780079039897...AlgebraISBN:9780079039897Author:CarterPublisher:McGraw Hill
 Big Ideas Math A Bridge To Success Algebra 1: Stu...AlgebraISBN:9781680331141Author:HOUGHTON MIFFLIN HARCOURTPublisher:Houghton Mifflin Harcourt
 College Algebra (MindTap Course List)AlgebraISBN:9781305652231Author:R. David Gustafson, Jeff HughesPublisher:Cengage Learning
 Holt Mcdougal Larson Pre-algebra: Student Edition...AlgebraISBN:9780547587776Author:HOLT MCDOUGALPublisher:HOLT MCDOUGAL