
Subpart (a):
The impact of technological advancement on TV production.
Subpart (a):
Explanation of Solution
When the technological advancement in production reduces the world price of televisions, the impact on the importer will be as follows: the importing price will fall, which will reduce the domestic price for televisions; this will increase the
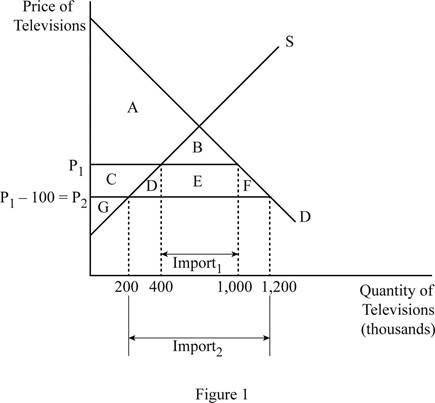
The world price was initially P1, where the consumer surplus was the area of A+B, producer surplus was the area of C+G and the total surplus was the area of A+B+C+G. The quantity of televisions imported is denoted by the Import1 on the graph. When the world price falls to P2 (P1 - 100), the consumer surplus increases to the area of A+B+C+D+E+F, which means that the consumer surplus increases by the area of C+D+E+F. The producer surplus becomes the area of G only which means that the producer surplus declined by the area of C. Thus, the total surplus becomes the area of A+B+C+D+E+F+G which means that the total surplus in the economy increased by the area of D+E+F. As a result of the lower price, the domestic supply falls and the demand increases; this means that the imports increase to Import2, as shown on the graph. The changes can be tabulated as follows:
| P1 | P2 | CHANGE | |
| Consumer Surplus | A + B | A + B + C + D + E + F | C + D + E + F |
| Producer Surplus | C + G | G | –C |
| Total Surplus | A + B + C + G | A + B + C + D + E + F + G | D + E + F |
Concept introduction:
International trade: It is the trade relation between the countries.
Export: It is the process of selling domestic goods in the international market. Thus, the goods produced in the domestic firms will be sold to other foreign countries. So, it is the outflow of domestic goods and services to the foreign economy.
Import: It is the process of purchasing the foreign-made goods and services by the domestic country. Thus, it is the inflow of foreign goods and services to the domestic economy.
Subpart (b):
The impact of technological advancement on TV production.
Subpart (b):
Explanation of Solution
The area of C can be calculated as follows:
Area of C is $30 million.
The area of D can be calculated as follows:
Area of D is $10 million.
The area of E can be calculated as follows:
Area of E is $60 million.
The area of F can be calculated as follows:
Area of F is $10 million.
The change in the consumer surplus is by the area of C+D+E+F. Thus, the value of change in consumer surplus can be calculated as follows:
Thus, the value of change in consumer surplus is by $110 million.
The change in the producer surplus is by the area of - C. Thus, the value of change in producer surplus is by $30 million.
The change in the total surplus is by the area of D+E+F. Thus, the value of change in total surplus can be calculated as follows:
Thus, the value of change in total surplus is by $80 million.
Concept introduction:
International trade: It is the trade relation between the countries.
Export: It is the process of selling domestic goods in the international market. Thus, the goods produced in the domestic firms will be sold to other foreign countries. So, it is the outflow of domestic goods and services to the foreign economy.
Import: It is the process of purchasing the foreign-made goods and services by the domestic country. Thus, it is the inflow of foreign goods and services to the domestic economy.
Comparative advantage: It is the ability of the country to produce the goods and services at lower opportunity costs than the other countries.
Subpart (c):
The impact of technological advancement on TV production.
Subpart (c):
Explanation of Solution
When the government imposes a tax of $100 on the imports, the price of the imports will increase by $100; this means that the price level will revert back to the initial world price. This denotes that the consumer surplus, producer surplus, and the total surplus will revert back to the initial levels. The consumer surplus will fall by the area of C+D+E+F, which is $110 million and the producer surplus will increase by the area of C, which is $30 million.
The government would earn a tax revenue through this and the tax revenue can be calculated as follows:
Thus, the government will earn a tax revenue of $60 million.
There will be
Concept introduction:
International trade: It is the trade relation between the countries.
Export: It is the process of selling domestic goods in the international market. Thus, the goods produced in the domestic firms will be sold to other foreign countries. So, it is the outflow of domestic goods and services to the foreign economy.
Import: It is the process of purchasing the foreign-made goods and services by the domestic country. Thus, it is the inflow of foreign goods and services to the domestic economy.
Comparative advantage: It is the ability of the country to produce the goods and services at lower opportunity costs than the other countries.
Subpart (d):
The impact of technological advancement on TV production.
Subpart (d):
Explanation of Solution
The fall in the world price benefits the consumers because they are able to get the commodity at lower price than before. Also, the consumer surplus increases by $110 million. The fall in the world price harms the domestic producers because it leads to a fall in the producer surplus by $30 million. Since the consumer is benefited much more than the producer is harmed, the total welfare of the economy increases. Thus, the reason behind the fall in the world price does not matter in the analysis.
Concept introduction:
International trade: It is the trade relation between the countries.
Export: It is the process of selling domestic goods in the international market. Thus, the goods produced in the domestic firms will be sold to other foreign countries. So, it is the outflow of domestic goods and services to the foreign economy.
Import: It is the process of purchasing the foreign-made goods and services by the domestic country. Thus, it is the inflow of foreign goods and services to the domestic economy.
Comparative advantage: It is the ability of the country to produce the goods and services at lower opportunity costs than the other countries.
Want to see more full solutions like this?
Chapter 9 Solutions
Principles of Economics, 7th Edition (MindTap Course List)

- Refer to the attached Wk 3 Graph for this assignment. The graph shows an increase in demand (shifting of the demand curve from D1 to D2). Choose an application or situation in the economy or a specific economic situation to describe this graph. Take into consideration the impact on quantity and price in your analysis. Given your analysis, what would cause the situation to go the opposite way? What would cause the situation to go further into the same direction?arrow_forwardClick on the link to study the Economics in the News. Then answer the following questions. 120- 118- 3. Use the AS-AD model to show the changes in aggregate demand and aggregate supply that occurred in 2016 and 2017 that brought the economy to its situation in mid-2017. The graph shows the U.S. economy in the second quarter of 2016. Draw and label the long-run aggregate supply curve in 2017. Draw and label the aggregate demand curve in 2017. Draw a point at the short-run macroeconomic equilibrium in the second quarter of 2017. 116- 114- ☑--- Price level (GDP deflator, 2009=100) LAS 16 112- 110- 108- 106- 104- 102- $16.7 100- 16.6 16.7 16.8 16.9 17.0 SAS 16 = SAS17 AD 16 17.1 17.2 17.3 Real GDP (trillions of 2009 dollars) >>> Draw only the objects specified in the question. LV ☑arrow_forwardPrice level (GDP deflator, 2009=100) Fed Raises Rates As Job Gains, Firming Inflation Stoke Confidence The U.S. Federal Reserve raised interest rates on Wednesday. The rate rise was the second in three months. This second rise comes in an economy that is growing faster and creating jobs at a more rapid pace. These gains are accompanied by a rising inflation rate. 140- 130- Source: Reuters, March 15, 2017 Describe the process by which the Fed's action reported in the news clip flows through the economy. 120- ... 110- LAS SAS → ☑ When the Fed raises the interest rate, A. aggregate demand decreases and short-run aggregate supply increases, and the price level falls B. aggregate demand increases and real GDP increases C. aggregate demand decreases and the price level falls D. short-run aggregate supply increases and the price level falls The graph shows the long-run aggregate supply curve and the short-run aggregate supply curve. Draw the AD curve to illustrate the state of the economy…arrow_forward
- Price level (GDP deflator, 2009=100) Millennials Are Starting to Spend More Millennials, who spend an average of $85 a day, are expected to spend at a higher rate in the next fifteen years. Only 37 percent of Americans report higher spending today than a year ago, while 42 percent of millennials say they are spending more. Millennials are spending more on rent or mortgages and leisure activities than they were spending a year ago. 140- 130- Source: Business Journal, May 25, 2016 120- Describe the macroeconomic equilibrium after the change in spending by millennials. If the economy had been at a below full-employment equilibrium, then the economy will A. move to an above full-employment equilibrium with real GDP less than potential GDP B. move to a full-employment equilibrium as short-run aggregate supply increases at the same time 'C. move to a full-employment equilibrium and equilibrium real GDP equals potential GDP D. remain stuck in a below full-employment equilibrium If the economy…arrow_forwardWolfgang is a typical producer in a perfectly competitive piano industry (i.e., all other producers of pianos face the same costs as Wolfgang). The following production and cost data apply to the long run as well as the short run. Fixed costs (rent) are unrecoverable in the short run and are equal to $2400 per month. Variable costs consist of raw materials (wire, wood, plastic), which cost $1000 per piano, and the $40 per hour opportunity cost of Wolfgang's time. Wolfgang's production function is given in the table at right. Wolfgang will shut down if the price per piano is less than OA. $3000. B. $4000. O C. $5000. ○ D. None of the above. Pianos (Q) Hours (L) Raw Materials ( 0 0 0 1 100 1000 2 150 2000 3 240 3000 4 400 4000arrow_forwardP2 P₁ $ per unit Using the graph below, determine which statement is TRUE. MC1 SRATC₁ Q1 Q₂ MC2 SRATC2 LRAC ✓ LEA Quantityarrow_forward
- Using the grapns below, wnicn snow the snort-run cost curves for 3 perfectly competitive firms in the same industry, determine whether the industry is in long-run equilibrium or not. Q Q Firm A QA MC ATC Output Firm B QB MC ATC Firm C MC ATC Output Output Qc If Firms A, B and C are in the same industry, is this industry in long-run equilibrium? ○ A. Yes, because P = MC = MR for each of the 3 firms. ○ B. No, because Firm A is not producing at a profit-maximizing level of output. ○ C. Yes, because all 3 firms are producing at their minimum average total cost. OD. The answer is uncertain since it's unknown whether the firms are producing at the minimum efficient scale or not. ○ E. No, because if the industry were in equilibrium, all 3 firms would be earning zero economic profits.arrow_forwardConsider the table on the right, which shows the various revenue concepts for a perfectly competitive firm. Suppose the firm faces a constant market price of $4. Compute first total revenue for each level of output and fill in the TR column of the table. Next, compute marginal revenue for each level of output and fill in the MR column of the table. (Marginal revenue at each level of output is computed using total revenue for two successive levels of output. For example, marginal revenue at 160 uses total revenue for output levels 120 and 160.) Total Marginal Price (p)Quantity (Q) Revenue (TR)Revenue (MR) $4 A EA 120 $4 160 $4 200 $4 240 $4 280 $ EA EA EA 10 S คarrow_forwardThis week we will be discussing measures of economic well-being. Read the following short article from the Office of National Statistics from the U.K. which discusses different measures of economic well-being: https://blog.ons.gov.uk/2017/07/06/beyond-gdp-measuring-the-economic-well-being-of-individuals/ For this assignment, we will narrow down to the economic well-being of the St. Louis region (or another region you choose). As the article indicates there are different measures of well-being. You are interested in creating a Hypothesis Test about the economic well-being of the area. Discuss the following issues: First, think about your research hypothesis and justify it briefly. Remember, a hypothesis is a well-thought and untested proposition. What is the null hypothesis? What is the parameter you are interested in? (i.e., the measure of well-being). Is it going to be a Lower-Tail, Upper-Tail or Two-Tailed test? What is the data that you need and how will you collect the data? What…arrow_forward
- Johnny brought $39.50 to the art supply store. He bought a brush, a sketchbook, and a paint set. The brush was 1 6 as much as the sketchbook, and the sketchbook cost 3 4 the cost of the paint set. Johnny had $2.00 left over after buying these items.arrow_forwardA young woman plans to retire early in 25 years. She believes she can save $10,000 each year starting now. If she plans to begin withdrawing money one year after she makes her last payment into the retirement account (i.e., in the 26th year), what uniform amount could she withdraw each year for 30 years, if the account earns an interest rate of 8% per year? a) Correctly plot the cash flow diagram with its respective vectors, arrowheads, units, and currency values. b) Correct mathematical approach and development, use of compound interest factors.c) Financial logic in the development of the exercise and application of the concept of time value of money. d) Final numerical answer and writing in prose with a minimum of 20 words and a maximum of 50 words of the obtained numerical interpretation.arrow_forwardA hospital charges $200 for a medical procedure, and 1,000 patients use the service. The hospital raises the price to $250, and the number of patients drops to 900. Calculate the price elasticity of demand (PED) and explain your answer. (show all working) Briefly explain how elasticity affects government health policies in the following cases: • Taxes on unhealthy products (cigarettes, alcohol, sugary drinks) • Subsidizing Preventive Care (e.g., vaccines, screenings) Drug Price Controls & Generic Substitutions Co-Payments & Insurance Designarrow_forward
 Principles of Macroeconomics (MindTap Course List)EconomicsISBN:9781285165912Author:N. Gregory MankiwPublisher:Cengage Learning
 Principles of Economics, 7th Edition (MindTap Cou...EconomicsISBN:9781285165875Author:N. Gregory MankiwPublisher:Cengage Learning
 Essentials of Economics (MindTap Course List)EconomicsISBN:9781337091992Author:N. Gregory MankiwPublisher:Cengage Learning
 Principles of MicroeconomicsEconomicsISBN:9781305156050Author:N. Gregory MankiwPublisher:Cengage Learning
 Principles of Economics (MindTap Course List)EconomicsISBN:9781305585126Author:N. Gregory MankiwPublisher:Cengage Learning
 Principles of Microeconomics (MindTap Course List)EconomicsISBN:9781305971493Author:N. Gregory MankiwPublisher:Cengage Learning