
(a)
To explain : In the given case, when the intersection is not a
The point at which the upper cone ends and the lower cone starts will not be a circle.
Given information :
A plane perpendicular to the cone's axis passes through the cone, intersecting it in a circle whose radius decreases and then increases.
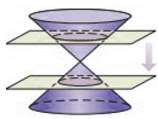
Explanation :
When a plane perpendicular to the cone's axis passes through the double napped cone and intersects the cone, it forms a
When the plane is moved from up to down then the point at which the upper cone ends and the lower cone starts, the radius will be zero, and therefore that point will not be a circle.
(b)
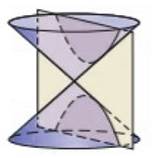
To explain : In the given case, when the intersection is not a hyperbola.
The point at which the two lines intersect is not a hyperbola.
Given information :
A plane parallel to the cone's axis passes through the cone, intersecting it in a hyperbola whose vertices get closer together and then farther apart.
Explanation :
When a plane parallel to the cone's axis passes through the double napped cone and intersects the cone, it forms a conic section called hyperbola.
When the plane passes through the axis of the double-napped cone, the point at which the two lines intersect is not a hyperbola.
Therefore the point at which the two lines intersect is not a hyperbola.
(c)
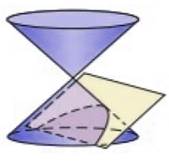
To explain : In the given case, when the intersection is not a parabola.
The point at which the plane gives a line is not a parabola.
Given information :
a plane parallel to the cone's nappe passes through the cone, intersecting it in a parabola that first gets narrower, then flips and gets wider.
Explanation :
When a plane parallel to the cone's nappe passes through the cone and intersects the cone, it forms a conic section called parabola.
When the plane moves from down to up of the double-napped cone, at the line of napping of the cones then the plane gives a line and this point is not a parabola.
Therefore the point at which the plane gives a line is not a parabola.
Chapter 8 Solutions
Holt Mcdougal Larson Algebra 2: Student Edition 2012

- 5) For each function represented by an equation, make a table and plot the corresponding points to sketch the graph of the function. (a) y = 75 ()* 220 X y 200- -2 180 160 -1 140 0 120 100 1 60 80 2 3 4 x (b) y = 20 ()* 1 60 40 20 20 0 2 3 65- -1 X y 60 -2 55- 50 45 44 40 0 35- 30 1 25 2 20 20 15 3 10 5 LO 4 3-2 T -1 0 5- 4- -3- 2-arrow_forwardA system of inequalities is shown. y 5 3 2 1 X -5 -4 -3 -2 -1 0 1 2 3 4 5 -1- Which system is represented in the graph? Oy>-x²-x+1 y 2x²+3 -2 -3 тarrow_forwardWhich set of systems of equations represents the solution to the graph? -5 -4 -3 -2 Of(x) = x² + 2x + 1 g(x) = x²+1 f(x) = x²+2x+1 g(x) = x²-1 f(x) = −x² + 2x + 1 g(x) = x²+1 f(x) = x² + 2x + 1 g(x) = x²-1 -1 5 y 4 3 2 1 0 -1- -2 -3- -4. -5 1 2 3 4 5arrow_forward
- Which of the graphs below correctly solves for x in the equation -x² - 3x-1=-x-4? о 10 8 (0,2) -10 -8 -6 -2 2 4 6 8 10 (-4,-2) -2 + (0,2) (4,6) -10-8-6-4-2 -2 2 4 6 8 10 (-3, -1) -2 2 (1-5) -6 -8 -10 10 -10-8-6-4-2 2 6 8 10 (2,0)arrow_forward1) Express these large and small numbers from the Read and Study section in scientific notation: (a) 239,000 miles (b) 3,800,000,000,000 sheets of paper (c) 0.0000000000000000000000167 grams 2) Find all values for the variable x that make these equations true. (a) 5x = 1 (b) 3x = 1/1 9 (c) 4* = 11/ 4 (e) 4* = 64 (g) 10x = 1,000,000 (d) 3x=-3 (f) 2x = = 8 (h) 10x = 0.001arrow_forward(b) 4) Find an equation to fit each of the following graphs: (a) 20 20 18 16 14 12 10 8 6 4 2 24 22 20 18 16 14 12 10 8 16 A 2 -3 -2 -1-0 2 3 4. -1 0 1 2 3. -2 -2arrow_forward
- 3) Which of the following are equivalent to 3? (There may be more than one that is equivalent!) -1 (a) (9)¯¹ 3. (b) (-3)-1 (c) (-3) -1 (d) -(¯3) (e) 11 3-1 (f) 3-4arrow_forwardY- ___b=_____ (X- )arrow_forwardFind the Laplace Transform of the function to express it in frequency domain form.arrow_forward
- Please draw a graph that represents the system of equations f(x) = x2 + 2x + 2 and g(x) = –x2 + 2x + 4?arrow_forwardGiven the following system of equations and its graph below, what can be determined about the slopes and y-intercepts of the system of equations? 7 y 6 5 4 3 2 -6-5-4-3-2-1 1+ -2 1 2 3 4 5 6 x + 2y = 8 2x + 4y = 12 The slopes are different, and the y-intercepts are different. The slopes are different, and the y-intercepts are the same. The slopes are the same, and the y-intercepts are different. O The slopes are the same, and the y-intercepts are the same.arrow_forwardChoose the function to match the graph. -2- 0 -7 -8 -9 --10- |--11- -12- f(x) = log x + 5 f(x) = log x - 5 f(x) = log (x+5) f(x) = log (x-5) 9 10 11 12 13 14arrow_forward
 Algebra and Trigonometry (6th Edition)AlgebraISBN:9780134463216Author:Robert F. BlitzerPublisher:PEARSON
 Contemporary Abstract AlgebraAlgebraISBN:9781305657960Author:Joseph GallianPublisher:Cengage Learning
 Linear Algebra: A Modern IntroductionAlgebraISBN:9781285463247Author:David PoolePublisher:Cengage Learning
 Algebra And Trigonometry (11th Edition)AlgebraISBN:9780135163078Author:Michael SullivanPublisher:PEARSON
 Introduction to Linear Algebra, Fifth EditionAlgebraISBN:9780980232776Author:Gilbert StrangPublisher:Wellesley-Cambridge Press
 College Algebra (Collegiate Math)AlgebraISBN:9780077836344Author:Julie Miller, Donna GerkenPublisher:McGraw-Hill Education