
ELEMENTARY STATISTICS W/MYMATHLAB<CUSTM
7th Edition
ISBN: 9781323839577
Author: Larson
Publisher: Pearson Custom Publishing
expand_more
expand_more
format_list_bulleted
Concept explainers
Videos
Textbook Question
Chapter 8.4, Problem 15E
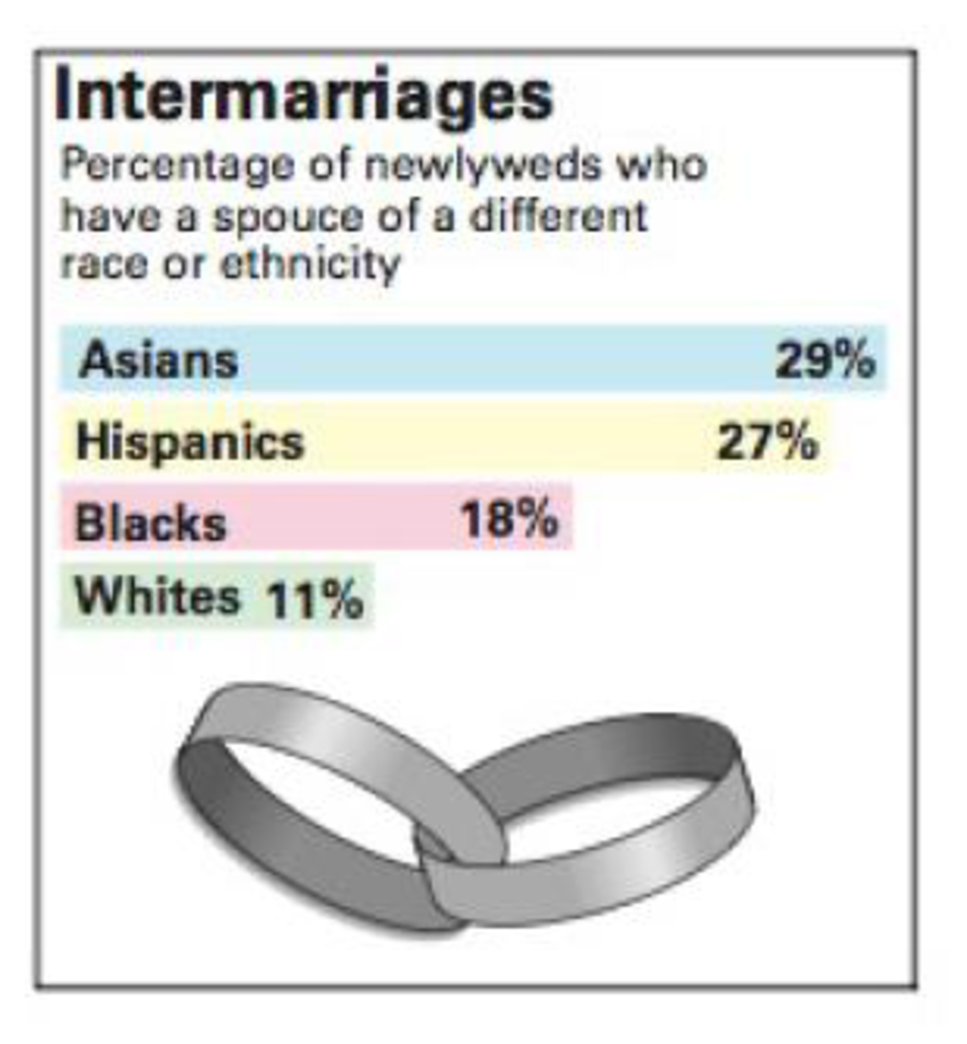
Intermarriages In Exercises 13–18, use the figure, which shows the percentages of newlyweds in the United States who have a spouse of a different race or ethnicity. The survey included random samples of 1000 Asian newlyweds, 1000 Hispanic newlyweds, 1000 black newlyweds, and 1000 white newlyweds. (Adapted from Pew Research Center)
15. Asians and Whiles At α = 0.01, can you support the claim that the proportion of newlywed Asians who have a spouse of a different race or ethnicity is greater than the proportion of newlywed whites who have a spouse of a different race or ethnicity?
Expert Solution & Answer
Want to see the full answer?
Check out a sample textbook solution
Students have asked these similar questions
توليد تمرين شامل حول الانحدار الخطي المتعدد بطريقة المربعات الصغرى
The U.S. Postal Service will ship a Priority Mail® Large Flat Rate Box (12" 3 12" 3 5½") any
where in the United States for a fixed price, regardless of weight. The weights (ounces) of 20 ran
domly chosen boxes are shown below. (a) Make a stem-and-leaf diagram. (b) Make a histogram.
(c) Describe the shape of the distribution. Weights
72 86 28 67 64 65 45 86 31 32
39 92 90 91 84 62 80 74 63 86
(a) What is a bimodal histogram? (b) Explain the difference between left-skewed, symmetric, and right-skewed histograms. (c) What is an outlier
Chapter 8 Solutions
ELEMENTARY STATISTICS W/MYMATHLAB<CUSTM
Ch. 8.1 - Classify each pair of samples as independent or...Ch. 8.1 - A survey indicates that the mean annual wages for...Ch. 8.1 - A travel agency claims that the average daily cost...Ch. 8.1 - What is the difference between two samples that...Ch. 8.1 - Explain how to perform a two-sample z-test for the...Ch. 8.1 - Describe another way you can perform a hypothesis...Ch. 8.1 - What conditions are necessary in order to use the...Ch. 8.1 - Prob. 5ECh. 8.1 - Prob. 6ECh. 8.1 - Independent and Dependent Samples In Exercises 58,...
Ch. 8.1 - Prob. 8ECh. 8.1 - In Exercises 9 and 10, use the TI-H4 Plus display...Ch. 8.1 - Prob. 10ECh. 8.1 - Prob. 11ECh. 8.1 - In Exercises 1114, test the claim about the...Ch. 8.1 - In Exercises 1114, test the claim about the...Ch. 8.1 - Prob. 14ECh. 8.1 - Testing the Difference Between Two Means In...Ch. 8.1 - Testing the Difference Between Two Means In...Ch. 8.1 - Prob. 17ECh. 8.1 - Prob. 18ECh. 8.1 - Prob. 19ECh. 8.1 - Testing the Difference Between Two Means In...Ch. 8.1 - Testing the Difference Between Two Means In...Ch. 8.1 - Prob. 22ECh. 8.1 - Prob. 23ECh. 8.1 - Prob. 24ECh. 8.1 - Prob. 25ECh. 8.1 - Getting at the Concept Explain why the null...Ch. 8.1 - Testing a Difference Other Than Zero Sometimes a...Ch. 8.1 - Testing a Difference Other Than Zero Sometimes a...Ch. 8.1 - Prob. 29ECh. 8.1 - Architect Salaries Construct a 99% confidence...Ch. 8.2 - The annual earnings of 25 people with a high...Ch. 8.2 - A manufacturer claims that the mean driving cost...Ch. 8.2 - What conditions are necessary in order to use the...Ch. 8.2 - Explain how to perform a two-sample t-test for the...Ch. 8.2 - Prob. 3ECh. 8.2 - Prob. 4ECh. 8.2 - Prob. 5ECh. 8.2 - Prob. 6ECh. 8.2 - In Exercises 38, use Table 5 in Appendix B to find...Ch. 8.2 - Prob. 8ECh. 8.2 - In Exercises 912, test the claim about the...Ch. 8.2 - Prob. 10ECh. 8.2 - Prob. 11ECh. 8.2 - In Exercises 912, test the claim about the...Ch. 8.2 - Testing the Difference Between Two Means in...Ch. 8.2 - Testing the Difference Between Two Means in...Ch. 8.2 - Testing the Difference Between Two Means in...Ch. 8.2 - Testing the Difference Between Two Means in...Ch. 8.2 - Prob. 17ECh. 8.2 - Prob. 18ECh. 8.2 - Prob. 19ECh. 8.2 - Testing the Difference Between Two Means in...Ch. 8.2 - Testing the Difference Between Two Means in...Ch. 8.2 - Testing the Difference Between Two Means in...Ch. 8.2 - Constructing Confidence Intervals for 1 2 When...Ch. 8.2 - Constructing Confidence Intervals for 1 2 When...Ch. 8.2 - Constructing Confidence Intervals for 1 2 When...Ch. 8.2 - Prob. 26ECh. 8.2 - How Protein Affects Weight Gain in Overeaters In a...Ch. 8.2 - Prob. 2CSCh. 8.2 - How Protein Affects Weight Gain in Overeaters In a...Ch. 8.2 - Prob. 4CSCh. 8.2 - Prob. 5CSCh. 8.3 - A shoe manufacturer claims that athletes can...Ch. 8.3 - Prob. 2TYCh. 8.3 - Prob. 1ECh. 8.3 - Prob. 2ECh. 8.3 - Prob. 3ECh. 8.3 - Prob. 4ECh. 8.3 - Prob. 5ECh. 8.3 - Prob. 6ECh. 8.3 - Prob. 7ECh. 8.3 - Prob. 8ECh. 8.3 - Prob. 9ECh. 8.3 - Testing the Difference Between Two Means In...Ch. 8.3 - Prob. 11ECh. 8.3 - Prob. 12ECh. 8.3 - Prob. 13ECh. 8.3 - Testing the Difference Between Two Means In...Ch. 8.3 - Prob. 15ECh. 8.3 - Prob. 16ECh. 8.3 - Testing the Difference Between Two Means In...Ch. 8.3 - Testing the Difference Between Two Means In...Ch. 8.3 - Testing the Difference Between Two Means In...Ch. 8.3 - Prob. 20ECh. 8.3 - Prob. 21ECh. 8.3 - Prob. 22ECh. 8.3 - Prob. 23ECh. 8.3 - Prob. 24ECh. 8.4 - Consider the results of the study discussed on...Ch. 8.4 - Prob. 2TYCh. 8.4 - What conditions are necessary in order to use the...Ch. 8.4 - Explain how to perform a two-sample z-test for the...Ch. 8.4 - In Exercises 36, determine whether a normal...Ch. 8.4 - Prob. 4ECh. 8.4 - Prob. 5ECh. 8.4 - In Exercises 36, determine whether a normal...Ch. 8.4 - Prob. 7ECh. 8.4 - Testing the Difference Between Two Proportions In...Ch. 8.4 - Prob. 9ECh. 8.4 - Prob. 10ECh. 8.4 - Prob. 11ECh. 8.4 - Testing the Difference Between Two Proportions In...Ch. 8.4 - Prob. 13ECh. 8.4 - Prob. 14ECh. 8.4 - Intermarriages In Exercises 1318, use the figure,...Ch. 8.4 - Prob. 16ECh. 8.4 - Prob. 17ECh. 8.4 - Intermarriages In Exercises 1318, use the figure,...Ch. 8.4 - Prob. 19ECh. 8.4 - Prob. 20ECh. 8.4 - Prob. 21ECh. 8.4 - U.S. Workforce In Exercises 1922, use the figure...Ch. 8.4 - Prob. 23ECh. 8.4 - Prob. 24ECh. 8.4 - Prob. 25ECh. 8.4 - Prob. 26ECh. 8 - Uses Hypothesis Testing with Two Samples...Ch. 8 - Medical research often involves blind and...Ch. 8 - Prob. 8.1.1RECh. 8 - Prob. 8.1.2RECh. 8 - Sample 1: The fuel efficiencies of 20 sports...Ch. 8 - Prob. 8.1.4RECh. 8 - Prob. 8.1.5RECh. 8 - In Exercises 58, test the claim about the...Ch. 8 - Prob. 8.1.7RECh. 8 - In Exercises 58, test the claim about the...Ch. 8 - In Exercises 9 and 10, (a) identify the claim and...Ch. 8 - Prob. 8.1.10RECh. 8 - Prob. 8.2.11RECh. 8 - Prob. 8.2.12RECh. 8 - Prob. 8.2.13RECh. 8 - Prob. 8.2.14RECh. 8 - Prob. 8.2.15RECh. 8 - Prob. 8.2.16RECh. 8 - Prob. 8.2.17RECh. 8 - Prob. 8.2.18RECh. 8 - Prob. 8.3.19RECh. 8 - In Exercises 1922, test the claim about the mean...Ch. 8 - Prob. 8.3.21RECh. 8 - Prob. 8.3.22RECh. 8 - Prob. 8.3.23RECh. 8 - In Exercises 23 and 24, (a) identify the claim and...Ch. 8 - Prob. 8.4.25RECh. 8 - Prob. 8.4.26RECh. 8 - Prob. 8.4.27RECh. 8 - Prob. 8.4.28RECh. 8 - Prob. 8.4.29RECh. 8 - Prob. 8.4.30RECh. 8 - Prob. 1CQCh. 8 - Prob. 2CQCh. 8 - Prob. 3CQCh. 8 - Prob. 4CQCh. 8 - Take this test as you would take a test in class....Ch. 8 - Prob. 2CTCh. 8 - A physical therapist suggests that soft tissue...Ch. 8 - Take this test as you would take a test in class....Ch. 8 - The U.S. Department of Health Human Services...Ch. 8 - Prob. 2RSRDCh. 8 - Prob. 3RSRDCh. 8 - Prob. 4RSRDCh. 8 - Prob. 1TCh. 8 - Prob. 2TCh. 8 - Prob. 3TCh. 8 - Prob. 4TCh. 8 - Prob. 5TCh. 8 - Prob. 1CRCh. 8 - Prob. 2CRCh. 8 - Prob. 3CRCh. 8 - Prob. 4CRCh. 8 - In Exercises 36, construct the indicated...Ch. 8 - In Exercises 36, construct the indicated...Ch. 8 - In Exercises 710, the statement represents a...Ch. 8 - In Exercises 710, the statement represents a...Ch. 8 - In Exercises 710, the statement represents a...Ch. 8 - In Exercises 710, the statement represents a...Ch. 8 - Prob. 11CRCh. 8 - Prob. 12CRCh. 8 - Prob. 13CRCh. 8 - Prob. 14CRCh. 8 - Prob. 15CRCh. 8 - Prob. 16CRCh. 8 - A researcher claims that 5% of people who wear...
Knowledge Booster


Learn more about
Need a deep-dive on the concept behind this application? Look no further. Learn more about this topic, statistics and related others by exploring similar questions and additional content below.Similar questions
- (a) Test the hypothesis. Consider the hypothesis test Ho = : against H₁o < 02. Suppose that the sample sizes aren₁ = 7 and n₂ = 13 and that $² = 22.4 and $22 = 28.2. Use α = 0.05. Ho is not ✓ rejected. 9-9 IV (b) Find a 95% confidence interval on of 102. Round your answer to two decimal places (e.g. 98.76).arrow_forwardLet us suppose we have some article reported on a study of potential sources of injury to equine veterinarians conducted at a university veterinary hospital. Forces on the hand were measured for several common activities that veterinarians engage in when examining or treating horses. We will consider the forces on the hands for two tasks, lifting and using ultrasound. Assume that both sample sizes are 6, the sample mean force for lifting was 6.2 pounds with standard deviation 1.5 pounds, and the sample mean force for using ultrasound was 6.4 pounds with standard deviation 0.3 pounds. Assume that the standard deviations are known. Suppose that you wanted to detect a true difference in mean force of 0.25 pounds on the hands for these two activities. Under the null hypothesis, 40 = 0. What level of type II error would you recommend here? Round your answer to four decimal places (e.g. 98.7654). Use a = 0.05. β = i What sample size would be required? Assume the sample sizes are to be equal.…arrow_forward= Consider the hypothesis test Ho: μ₁ = μ₂ against H₁ μ₁ μ2. Suppose that sample sizes are n₁ = 15 and n₂ = 15, that x1 = 4.7 and X2 = 7.8 and that s² = 4 and s² = 6.26. Assume that o and that the data are drawn from normal distributions. Use απ 0.05. (a) Test the hypothesis and find the P-value. (b) What is the power of the test in part (a) for a true difference in means of 3? (c) Assuming equal sample sizes, what sample size should be used to obtain ẞ = 0.05 if the true difference in means is - 2? Assume that α = 0.05. (a) The null hypothesis is 98.7654). rejected. The P-value is 0.0008 (b) The power is 0.94 . Round your answer to four decimal places (e.g. Round your answer to two decimal places (e.g. 98.76). (c) n₁ = n2 = 1 . Round your answer to the nearest integer.arrow_forward
- Consider the hypothesis test Ho: = 622 against H₁: 6 > 62. Suppose that the sample sizes are n₁ = 20 and n₂ = 8, and that = 4.5; s=2.3. Use a = 0.01. (a) Test the hypothesis. Round your answers to two decimal places (e.g. 98.76). The test statistic is fo = i The critical value is f = Conclusion: i the null hypothesis at a = 0.01. (b) Construct the confidence interval on 02/022 which can be used to test the hypothesis: (Round your answer to two decimal places (e.g. 98.76).) iarrow_forward2011 listing by carmax of the ages and prices of various corollas in a ceratin regionarrow_forwardس 11/ أ . اذا كانت 1 + x) = 2 x 3 + 2 x 2 + x) هي متعددة حدود محسوبة باستخدام طريقة الفروقات المنتهية (finite differences) من جدول البيانات التالي للدالة (f(x . احسب قيمة . ( 2 درجة ) xi k=0 k=1 k=2 k=3 0 3 1 2 2 2 3 αarrow_forward
- 1. Differentiate between discrete and continuous random variables, providing examples for each type. 2. Consider a discrete random variable representing the number of patients visiting a clinic each day. The probabilities for the number of visits are as follows: 0 visits: P(0) = 0.2 1 visit: P(1) = 0.3 2 visits: P(2) = 0.5 Using this information, calculate the expected value (mean) of the number of patient visits per day. Show all your workings clearly. Rubric to follow Definition of Random variables ( clearly and accurately differentiate between discrete and continuous random variables with appropriate examples for each) Identification of discrete random variable (correctly identifies "number of patient visits" as a discrete random variable and explains reasoning clearly.) Calculation of probabilities (uses the probabilities correctly in the calculation, showing all steps clearly and logically) Expected value calculation (calculate the expected value (mean)…arrow_forwardif the b coloumn of a z table disappeared what would be used to determine b column probabilitiesarrow_forwardConstruct a model of population flow between metropolitan and nonmetropolitan areas of a given country, given that their respective populations in 2015 were 263 million and 45 million. The probabilities are given by the following matrix. (from) (to) metro nonmetro 0.99 0.02 metro 0.01 0.98 nonmetro Predict the population distributions of metropolitan and nonmetropolitan areas for the years 2016 through 2020 (in millions, to four decimal places). (Let x, through x5 represent the years 2016 through 2020, respectively.) x₁ = x2 X3 261.27 46.73 11 259.59 48.41 11 257.96 50.04 11 256.39 51.61 11 tarrow_forward
- If the average price of a new one family home is $246,300 with a standard deviation of $15,000 find the minimum and maximum prices of the houses that a contractor will build to satisfy 88% of the market valuearrow_forward21. ANALYSIS OF LAST DIGITS Heights of statistics students were obtained by the author as part of an experiment conducted for class. The last digits of those heights are listed below. Construct a frequency distribution with 10 classes. Based on the distribution, do the heights appear to be reported or actually measured? Does there appear to be a gap in the frequencies and, if so, how might that gap be explained? What do you know about the accuracy of the results? 3 4 555 0 0 0 0 0 0 0 0 0 1 1 23 3 5 5 5 5 5 5 5 5 5 5 5 5 6 6 8 8 8 9arrow_forwardA side view of a recycling bin lid is diagramed below where two panels come together at a right angle. 45 in 24 in Width? — Given this information, how wide is the recycling bin in inches?arrow_forward
arrow_back_ios
SEE MORE QUESTIONS
arrow_forward_ios
Recommended textbooks for you
 Big Ideas Math A Bridge To Success Algebra 1: Stu...AlgebraISBN:9781680331141Author:HOUGHTON MIFFLIN HARCOURTPublisher:Houghton Mifflin Harcourt
 Glencoe Algebra 1, Student Edition, 9780079039897...AlgebraISBN:9780079039897Author:CarterPublisher:McGraw Hill
 Holt Mcdougal Larson Pre-algebra: Student Edition...AlgebraISBN:9780547587776Author:HOLT MCDOUGALPublisher:HOLT MCDOUGAL
Big Ideas Math A Bridge To Success Algebra 1: Stu...
Algebra
ISBN:9781680331141
Author:HOUGHTON MIFFLIN HARCOURT
Publisher:Houghton Mifflin Harcourt
Glencoe Algebra 1, Student Edition, 9780079039897...
Algebra
ISBN:9780079039897
Author:Carter
Publisher:McGraw Hill
Holt Mcdougal Larson Pre-algebra: Student Edition...
Algebra
ISBN:9780547587776
Author:HOLT MCDOUGAL
Publisher:HOLT MCDOUGAL
Statistics 4.1 Point Estimators; Author: Dr. Jack L. Jackson II;https://www.youtube.com/watch?v=2MrI0J8XCEE;License: Standard YouTube License, CC-BY
Statistics 101: Point Estimators; Author: Brandon Foltz;https://www.youtube.com/watch?v=4v41z3HwLaM;License: Standard YouTube License, CC-BY
Central limit theorem; Author: 365 Data Science;https://www.youtube.com/watch?v=b5xQmk9veZ4;License: Standard YouTube License, CC-BY
Point Estimate Definition & Example; Author: Prof. Essa;https://www.youtube.com/watch?v=OTVwtvQmSn0;License: Standard Youtube License
Point Estimation; Author: Vamsidhar Ambatipudi;https://www.youtube.com/watch?v=flqhlM2bZWc;License: Standard Youtube License