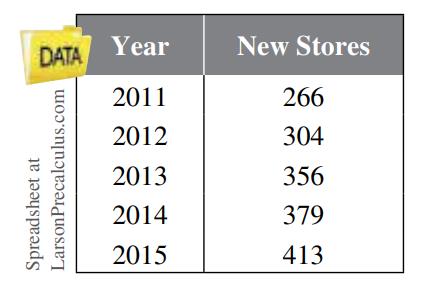
Business The table shows the net numbers of new stores opened by H&M from 2011 through 2015. (a) Construct a bar graph showing the annual net numbers of new stores opened by H&M from 2011 through 2015. (b) Find the n th term a n of an arithmetic sequence that approximates the data. Let n represent the year, with n = 1 corresponding to 2011. (Hint: Use the average change per year for d . ) (c) Use a graphing utility to graph the terms of the finite sequence you found in part (b). (d) Use summation notation to represent the total number of new stores opened from 2011 through 2015. Use this sum to approximate the total number of new stores opened during these years.
Business The table shows the net numbers of new stores opened by H&M from 2011 through 2015. (a) Construct a bar graph showing the annual net numbers of new stores opened by H&M from 2011 through 2015. (b) Find the n th term a n of an arithmetic sequence that approximates the data. Let n represent the year, with n = 1 corresponding to 2011. (Hint: Use the average change per year for d . ) (c) Use a graphing utility to graph the terms of the finite sequence you found in part (b). (d) Use summation notation to represent the total number of new stores opened from 2011 through 2015. Use this sum to approximate the total number of new stores opened during these years.
Solution Summary: The author explains how to calculate the nth term of the arithmetic sequence that approximates the data.
Business The table shows the net numbers of new stores opened by H&M from 2011 through 2015.
(a) Construct a bar graph showing the annual net numbers of new stores opened by H&M from 2011 through 2015.
(b) Find the
n
th
term
a
n
of an arithmetic sequence that approximates the data. Let
n
represent the year, with
n
=
1
corresponding to 2011. (Hint: Use the average change per year for
d
.
)
(c) Use a graphing utility to graph the terms of the finite sequence you found in part (b).
(d) Use summation notation to represent the total number of new stores opened from 2011 through 2015. Use this sum to approximate the total number of new stores opened during these years.
A research study in the year 2009 found that there were 2760 coyotes
in a given region. The coyote population declined at a rate of 5.8%
each year.
How many fewer coyotes were there in 2024 than in 2015?
Explain in at least one sentence how you solved the problem. Show
your work. Round your answer to the nearest whole number.
Answer the following questions related to the following matrix
A =
3
³).
Need a deep-dive on the concept behind this application? Look no further. Learn more about this topic, algebra and related others by exploring similar questions and additional content below.


 College AlgebraAlgebraISBN:9781305115545Author:James Stewart, Lothar Redlin, Saleem WatsonPublisher:Cengage Learning
 College Algebra (MindTap Course List)AlgebraISBN:9781305652231Author:R. David Gustafson, Jeff HughesPublisher:Cengage Learning
 Functions and Change: A Modeling Approach to Coll...AlgebraISBN:9781337111348Author:Bruce Crauder, Benny Evans, Alan NoellPublisher:Cengage Learning
 Elementary AlgebraAlgebraISBN:9780998625713Author:Lynn Marecek, MaryAnne Anthony-SmithPublisher:OpenStax - Rice University