Concept explainers
Videos
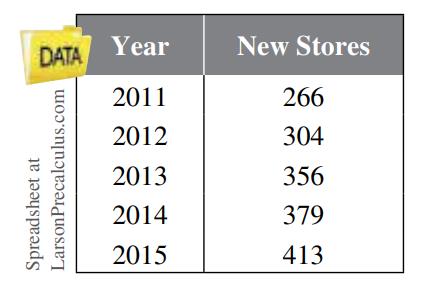
Business The table shows the net numbers of new stores opened by H&M from 2011 through 2015.
(a) Construct a bar graph showing the annual net numbers of new stores opened by H&M from 2011 through 2015.
(b) Find the
(c) Use a graphing utility to graph the terms of the finite sequence you found in part (b).
(d) Use summation notation to represent the total number of new stores opened from 2011 through 2015. Use this sum to approximate the total number of new stores opened during these years.
Want to see the full answer?
Check out a sample textbook solution
Chapter 8 Solutions
College Algebra Real Mathematics Real People Edition 7


- Solve questions by Course Name (Ordinary Differential Equations II 2)arrow_forwardplease Solve questions by Course Name( Ordinary Differential Equations II 2)arrow_forwardInThe Northern Lights are bright flashes of colored light between 50 and 200 miles above Earth. Suppose a flash occurs 150 miles above Earth. What is the measure of arc BD, the portion of Earth from which the flash is visible? (Earth’s radius is approximately 4000 miles.)arrow_forward
- e). n! (n - 1)!arrow_forwardSuppose you flip a fair two-sided coin four times and record the result. a). List the sample space of this experiment. That is, list all possible outcomes that could occur when flipping a fair two-sided coin four total times. Assume the two sides of the coin are Heads (H) and Tails (T).arrow_forwarde). n! (n - 1)!arrow_forward
- Evaluate the following expression and show your work to support your calculations. a). 6! b). 4! 3!0! 7! c). 5!2! d). 5!2! e). n! (n - 1)!arrow_forwardAmy and Samiha have a hat that contains two playing cards, one ace and one king. They are playing a game where they randomly pick a card out of the hat four times, with replacement. Amy thinks that the probability of getting exactly two aces in four picks is equal to the probability of not getting exactly two aces in four picks. Samiha disagrees. She thinks that the probability of not getting exactly two aces is greater. The sample space of possible outcomes is listed below. A represents an ace, and K represents a king. Who is correct?arrow_forwardConsider the exponential function f(x) = 12x. Complete the sentences about the key features of the graph. The domain is all real numbers. The range is y> 0. The equation of the asymptote is y = 0 The y-intercept is 1arrow_forward

 College AlgebraAlgebraISBN:9781305115545Author:James Stewart, Lothar Redlin, Saleem WatsonPublisher:Cengage Learning
 College Algebra (MindTap Course List)AlgebraISBN:9781305652231Author:R. David Gustafson, Jeff HughesPublisher:Cengage Learning
 Functions and Change: A Modeling Approach to Coll...AlgebraISBN:9781337111348Author:Bruce Crauder, Benny Evans, Alan NoellPublisher:Cengage Learning
 Elementary AlgebraAlgebraISBN:9780998625713Author:Lynn Marecek, MaryAnne Anthony-SmithPublisher:OpenStax - Rice University