Exercises 55-58 refer to the following plot of some level curves of f ( x , y ) = c for c = − 2 , 0 , 2 , 4 , and 6. (Each grid square is 1 u n i t × 1 u n i t .) [ Hint: See Example 8.] At approximately which point or points does f appear to attain a maximum value?
Exercises 55-58 refer to the following plot of some level curves of f ( x , y ) = c for c = − 2 , 0 , 2 , 4 , and 6. (Each grid square is 1 u n i t × 1 u n i t .) [ Hint: See Example 8.] At approximately which point or points does f appear to attain a maximum value?
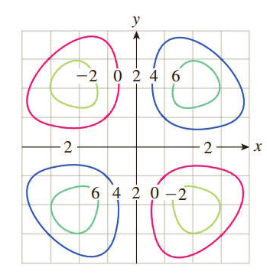
Exercises 55-58 refer to the following plot of some level curves of
f
(
x
,
y
)
=
c
for
c
=
−
2
,
0
,
2
,
4
, and 6. (Each grid square is
1
u
n
i
t
×
1
u
n
i
t
.) [Hint: See Example 8.]
At approximately which point or points does f appear to attain a maximum value?
a
->
f(x) = f(x) = [x] show that whether f is continuous function or not(by using theorem)
Muslim_maths
Use Green's Theorem to evaluate F. dr, where
F = (√+4y, 2x + √√)
and C consists of the arc of the curve y = 4x - x² from (0,0) to (4,0) and the line segment from (4,0) to
(0,0).
Evaluate
F. dr where F(x, y, z) = (2yz cos(xyz), 2xzcos(xyz), 2xy cos(xyz)) and C is the line
π 1
1
segment starting at the point (8,
'
and ending at the point (3,
2
3'6
Need a deep-dive on the concept behind this application? Look no further. Learn more about this topic, calculus and related others by exploring similar questions and additional content below.
Area Between The Curve Problem No 1 - Applications Of Definite Integration - Diploma Maths II; Author: Ekeeda;https://www.youtube.com/watch?v=q3ZU0GnGaxA;License: Standard YouTube License, CC-BY


 Algebra & Trigonometry with Analytic GeometryAlgebraISBN:9781133382119Author:SwokowskiPublisher:Cengage
 Algebra and Trigonometry (MindTap Course List)AlgebraISBN:9781305071742Author:James Stewart, Lothar Redlin, Saleem WatsonPublisher:Cengage Learning