
Finite Mathematics & Its Applications (12th Edition)
12th Edition
ISBN: 9780134507125
Author: Goldstein
Publisher: PEARSON
expand_more
expand_more
format_list_bulleted
Concept explainers
Videos
Question
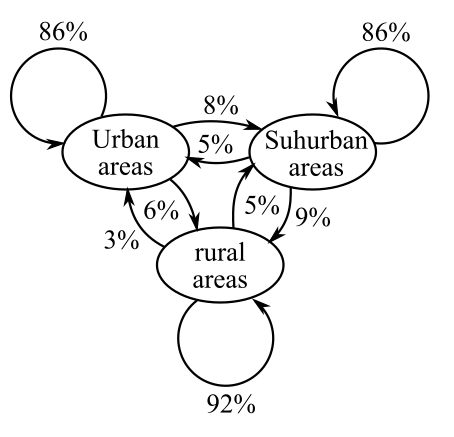
Chapter 8.1, Problem 31E
(a)
To determine
The stochastic matrix for the provided transition diagram,
 .
.
(b)
To determine
To calculate: The percentage of people who live in urban areas in 2017 will live in rural areas in 2019.
Expert Solution & Answer
Want to see the full answer?
Check out a sample textbook solution
Students have asked these similar questions
An airplane flies due west at an airspeed of 428 mph. The wind blows in the direction of 41° south of west
at 50 mph. What is the ground speed of the airplane? What is the bearing of the airplane?
428 mph
41°
50 mph
a. The ground speed of the airplane is
b. The bearing of the airplane is
mph.
south of west.
Rylee's car is stuck in the mud. Roman and Shanice come along in a truck to help pull her out. They attach
one end of a tow strap to the front of the car and the other end to the truck's trailer hitch, and the truck
starts to pull. Meanwhile, Roman and Shanice get behind the car and push. The truck generates a
horizontal force of 377 lb on the car. Roman and Shanice are pushing at a slight upward angle and generate
a force of 119 lb on the car. These forces can be represented by vectors, as shown in the figure below. The
angle between these vectors is 20.2°. Find the resultant force (the vector sum), then give its magnitude
and its direction angle from the positive x-axis.
119 lb
20.2°
377 lb
a. The resultant force is
(Tip: omit degree notations from your answers; e.g. enter cos(45) instead of cos(45°))
b. It's magnitude is
lb.
c. It's angle from the positive x-axis is
Complete the table below. For solutions, round to the nearest whole
number.
Chapter 8 Solutions
Finite Mathematics & Its Applications (12th Edition)
Ch. 8.1 - 1. Is a stochastic matrix?
Ch. 8.1 - 2. Learning Process An elementary learning process...Ch. 8.1 - In Exercises 1-6, determine whether or not the...Ch. 8.1 - In Exercises 1-6, determine whether or not the...Ch. 8.1 - In Exercises 1-6, determine whether or not the...Ch. 8.1 - Prob. 4ECh. 8.1 - In Exercises 1-6, determine whether or not the...Ch. 8.1 - Prob. 6ECh. 8.1 - In Exercises 7–12, write a stochastic matrix...Ch. 8.1 - Prob. 8E
Ch. 8.1 - Prob. 9ECh. 8.1 - Prob. 10ECh. 8.1 - Prob. 11ECh. 8.1 - Prob. 12ECh. 8.1 - In Exercises 13–18, draw a transition diagram...Ch. 8.1 - Prob. 14ECh. 8.1 - Prob. 15ECh. 8.1 - Prob. 16ECh. 8.1 - Prob. 17ECh. 8.1 - Prob. 18ECh. 8.1 - Woman in the Labor Force Referring to Example 5,...Ch. 8.1 - Prob. 20ECh. 8.1 - Cell Phone Usag e A cell phone provider classifies...Ch. 8.1 - Health Plan Option A university faculty health...Ch. 8.1 - Population Movement The Southwestern states were...Ch. 8.1 - Prob. 24ECh. 8.1 - T-Maze Each day, mice are put into a T-maze (a...Ch. 8.1 - 26. Analysis of a Poem In 1913, Markov analyzed a...Ch. 8.1 - Taxi Zones Refer to Example 7 (taxi zones). If,...Ch. 8.1 - Fitness A group of physical fitness devotees works...Ch. 8.1 - 29. Political Views According to the Higher...Ch. 8.1 - 30. Student Residences According to the Higher...Ch. 8.1 - Prob. 31ECh. 8.1 - Prob. 32ECh. 8.1 - Prob. 33ECh. 8.1 - Prob. 34ECh. 8.1 - Ehrenfest Urn Model The Ehrenfest urn model was...Ch. 8.1 - Prob. 36ECh. 8.1 - Prob. 37ECh. 8.1 - Prob. 38ECh. 8.1 - Prob. 39ECh. 8.1 - Prob. 40ECh. 8.1 - Prob. 41ECh. 8.1 - Prob. 42ECh. 8.1 - Prob. 43ECh. 8.1 - Prob. 44ECh. 8.1 - Prob. 45ECh. 8.1 - Prob. 46ECh. 8.1 - Prob. 47ECh. 8.1 - Prob. 48ECh. 8.1 - Prob. 49ECh. 8.1 - Repeat Exercise 49 for the matrices of Exercise...Ch. 8.1 - Prob. 51ECh. 8.1 - Prob. 52ECh. 8.2 - Solutions can be found following the section...Ch. 8.2 - Solutions can be found following the section...Ch. 8.2 - Solutions can be found following the section...Ch. 8.2 - In Exercises 16, determine whether or not the...Ch. 8.2 - In Exercises 16, determine whether or not the...Ch. 8.2 - In Exercises 16, determine whether or not the...Ch. 8.2 - In Exercises 16, determine whether or not the...Ch. 8.2 - In Exercises 1–6, determine whether or not the...Ch. 8.2 - In Exercises 16, determine whether or not the...Ch. 8.2 - In Exercises 7–12, find the stable distribution...Ch. 8.2 - In Exercises 712, find the stable distribution for...Ch. 8.2 - In Exercises 712, find the stable distribution for...Ch. 8.2 - In Exercises 7–12, find the stable distribution...Ch. 8.2 - In Exercises 712, find the stable distribution for...Ch. 8.2 - In Exercises 712, find the stable distribution for...Ch. 8.2 - Prob. 13ECh. 8.2 - Voter Patterns Refer to Exercise 24 of Section...Ch. 8.2 - Prob. 15ECh. 8.2 - Computer Reliability A certain university has a...Ch. 8.2 - Brand Loyalty Suppose that 60% of people who own a...Ch. 8.2 - 18. Transportation Modes Commuters can get into...Ch. 8.2 - Weather Patterns The changes in weather from day...Ch. 8.2 - 20. Women in the Labor Force Refer to the...Ch. 8.2 - 21. Car Rentals The Day-by-Day car rental agency...Ch. 8.2 - 22. Fitness Refer to Exercise 28 of Section 8.1....Ch. 8.2 - Genetics With respect to a certain gene,...Ch. 8.2 - 24. Weather Patterns The day-to-day changes in...Ch. 8.2 - Prob. 25ECh. 8.2 - Prob. 26ECh. 8.2 - Birth Weights Refer to Exercise 33 of Section 8.1....Ch. 8.2 - Bird Migrations Figure 5 describes the migration...Ch. 8.2 - Prob. 29ECh. 8.2 - Prob. 30ECh. 8.2 - Prob. 31ECh. 8.2 - Prob. 32ECh. 8.3 - 1. When an absorbing stochastic matrix is...Ch. 8.3 - Prob. 2CYUCh. 8.3 - Is [1.400.2.10.4.9] an absorbing stochastic...Ch. 8.3 - In Exercises 14, determine whether the transition...Ch. 8.3 - In Exercises 14, determine whether the transition...Ch. 8.3 - In Exercises 1–4, determine whether the transition...Ch. 8.3 - Prob. 4ECh. 8.3 - Prob. 5ECh. 8.3 - In Exercises 58, determine whether the given...Ch. 8.3 - Prob. 7ECh. 8.3 - Prob. 8ECh. 8.3 - Prob. 9ECh. 8.3 - Prob. 10ECh. 8.3 - Prob. 11ECh. 8.3 - In Exercises 912, convert the absorbing stochastic...Ch. 8.3 - The matrices in Exercises 1318 are absorbing...Ch. 8.3 - Prob. 14ECh. 8.3 - Prob. 15ECh. 8.3 - The matrices in Exercises 1318 are absorbing...Ch. 8.3 - Prob. 17ECh. 8.3 - Prob. 18ECh. 8.3 - Prob. 19ECh. 8.3 - Gambler’s Ruin Exercises 19 and 20 refer to...Ch. 8.3 - Gambler’s Ruin Exercises 19 and 20 refer to...Ch. 8.3 - Prob. 22ECh. 8.3 - Mouse in a Maze A mouse is placed in one of the...Ch. 8.3 - Prob. 24ECh. 8.3 - 25. Class Standings Suppose that the ...Ch. 8.3 - Quality Control A manufacturer of precise...Ch. 8.3 - Prob. 27ECh. 8.3 - Job Mobility The managers in a company are...Ch. 8.3 - Prob. 29ECh. 8.3 - Prob. 30ECh. 8.3 - Collecting Quotations A soft drink manufacturer...Ch. 8.3 - Tennis Consider a game of tennis between player A...Ch. 8.3 - Prob. 33ECh. 8.3 - Repeat Exercise 33 for the matrix...Ch. 8 - 1. What is a Markov process?
Ch. 8 - Prob. 2FCCECh. 8 - Prob. 3FCCECh. 8 - Prob. 4FCCECh. 8 - Define regular stochastic matrix.Ch. 8 - 6. Define the stable matrix and the stable...Ch. 8 - Prob. 7FCCECh. 8 - Prob. 8FCCECh. 8 - Prob. 9FCCECh. 8 - Prob. 10FCCECh. 8 - Prob. 11FCCECh. 8 - In Exercises 16, determine whether or not the...Ch. 8 - Prob. 2RECh. 8 - Prob. 3RECh. 8 - Prob. 4RECh. 8 - Prob. 5RECh. 8 - In Exercises 16, determine whether or not the...Ch. 8 - Prob. 7RECh. 8 - Prob. 8RECh. 8 - Prob. 9RECh. 8 - Quality Control In a certain factory, some...Ch. 8 - Prob. 11RECh. 8 - 12. Mouse in a House Figure 1 gives the layout of...Ch. 8 - 13. Which of the following is the stable...Ch. 8 - Prob. 14RECh. 8 - Prob. 15RECh. 8 - Prob. 16RECh. 8 - Prob. 17RECh. 8 - Prob. 18RECh. 8 - Prob. 19RECh. 8 - Prob. 20RECh. 8 - Prob. 21RECh. 8 - Prob. 22RECh. 8 - Prob. 1PCh. 8 - Prob. 2PCh. 8 - Prob. 3PCh. 8 - We will now show that the product of any two ...Ch. 8 - Prob. 5PCh. 8 - We will now show that the product of any two ...Ch. 8 - Prob. 7P
Knowledge Booster


Learn more about
Need a deep-dive on the concept behind this application? Look no further. Learn more about this topic, subject and related others by exploring similar questions and additional content below.Similar questions
- A biologist is investigating the effect of potential plant hormones by treating 20 stem segments. At the end of the observation period he computes the following length averages: Compound X = 1.18 Compound Y = 1.17 Based on these mean values he concludes that there are no treatment differences. 1) Are you satisfied with his conclusion? Why or why not? 2) If he asked you for help in analyzing these data, what statistical method would you suggest that he use to come to a meaningful conclusion about his data and why? 3) Are there any other questions you would ask him regarding his experiment, data collection, and analysis methods?arrow_forwardBusinessarrow_forwardAnswer first questionarrow_forward
- Let the universal set be whole numbers 1 through 20 inclusive. That is, U = {1, 2, 3, 4, . . ., 19, 20}. Let A, B, and C be subsets of U. Let A be the set of all prime numbers: A = {2, 3, 5, 7, 11, 13, 17, 19} Let B be the set of all odd numbers: B = {1,3,5,7, . . ., 17, 19} Let C be the set of all square numbers: C = {1,4,9,16}arrow_forwardA research team consists of 4 senior researchers and 10 research assistants. The team needs to select 2 senior researchers and 2 research assistants to attend a conference. How many different ways can the group being sent to the conference be formed?arrow_forwardThere are 25 different varieties of flowering plants found in a natural habitat you are studying. You are asked to randomly select 5 of these flowering plant varieties to bring back to your laboratory for further study. How many different combinations of are possible? That is, how many possible 5 plant subgroups can be formed out of the 25 total plants found?arrow_forward
- A person is tossing a fair, two-sided coin three times and recording the results (either a Heads, H, or a Tails, T). Let E be the event that exactly two heads are tossed. Which of the following sets represent the event E? Group of answer choices {HHT, HTH, THH} {HHT, THH} {HHH, HHT, HTH, THH, TTT, TTH, THT, HTT} {HH}arrow_forwardTake Quiz 54m Exit Let the universal set be whole numbers 1 through 20 inclusive. That is, U = {1, 2, 3, 4, . . ., 19, 20}. Let A, B, and C be subsets of U. Let A be the set of all prime numbers: A = {2, 3, 5, 7, 11, 13, 17, 19} Let B be the set of all odd numbers: B = {1,3,5,7, • • , 17, 19} Let C be the set of all square numbers: C = {1,4,9,16} ☐ Question 2 3 pts Which of the following statement(s) is true? Select all that apply. (1) АСВ (2) A and C are disjoint (mutually exclusive) sets. (3) |B| = n(B) = 10 (4) All of the elements in AC are even numbers. ☐ Statement 1 is true. Statement 2 is true. Statement 3 is true. Statement 4 is true.arrow_forward☐ Question 1 2 pts Let G be the set that represents all whole numbers between 5 and 12 exclusive. Which of the following is set G in standard set notation. (Roster Method)? O G = [5, 12] G = {5, 6, 7, 8, 9, 10, 11, 12} O G = (5, 12) OG = {6, 7, 8, 9, 10, 11}arrow_forward
arrow_back_ios
SEE MORE QUESTIONS
arrow_forward_ios
Recommended textbooks for you
 Elementary Linear Algebra (MindTap Course List)AlgebraISBN:9781305658004Author:Ron LarsonPublisher:Cengage Learning
 Linear Algebra: A Modern IntroductionAlgebraISBN:9781285463247Author:David PoolePublisher:Cengage Learning
 Functions and Change: A Modeling Approach to Coll...AlgebraISBN:9781337111348Author:Bruce Crauder, Benny Evans, Alan NoellPublisher:Cengage Learning
 Trigonometry (MindTap Course List)TrigonometryISBN:9781337278461Author:Ron LarsonPublisher:Cengage Learning
Elementary Linear Algebra (MindTap Course List)
Algebra
ISBN:9781305658004
Author:Ron Larson
Publisher:Cengage Learning
Linear Algebra: A Modern Introduction
Algebra
ISBN:9781285463247
Author:David Poole
Publisher:Cengage Learning
Functions and Change: A Modeling Approach to Coll...
Algebra
ISBN:9781337111348
Author:Bruce Crauder, Benny Evans, Alan Noell
Publisher:Cengage Learning
Trigonometry (MindTap Course List)
Trigonometry
ISBN:9781337278461
Author:Ron Larson
Publisher:Cengage Learning
Sampling Methods and Bias with Surveys: Crash Course Statistics #10; Author: CrashCourse;https://www.youtube.com/watch?v=Rf-fIpB4D50;License: Standard YouTube License, CC-BY
Statistics: Sampling Methods; Author: Mathispower4u;https://www.youtube.com/watch?v=s6ApdTvgvOs;License: Standard YouTube License, CC-BY