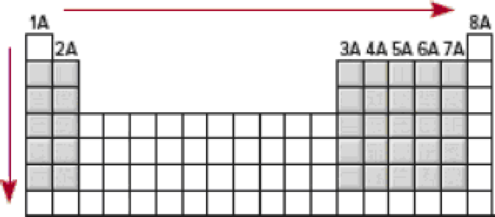
On the same graph, plot the effective nuclear charge (see Section 8.3) and atomic radius (see Figure 8.5) versus

The increase in effective nuclear charge from left to right across a period and from top to bottom in a group for representative elements.
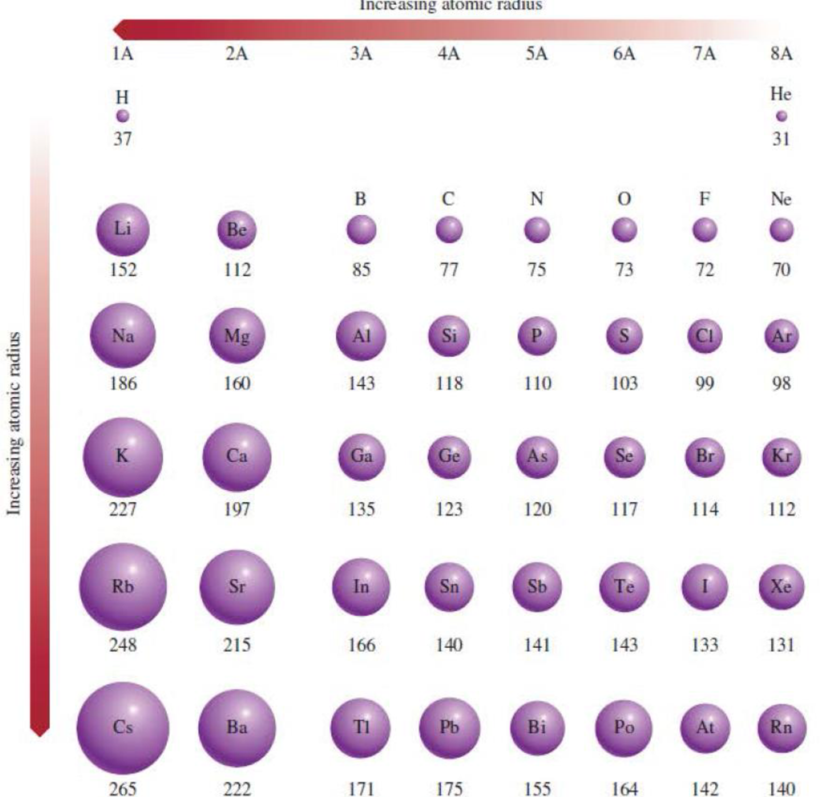
Figure 8.5 Atomic radii (in picometers) of representative elements according to their
positions in the periodic table. Note that there is no general agreement on the size of atomic radii. We focus only on the trends in atomic radii, not on their precise values.

Want to see the full answer?
Check out a sample textbook solution
Chapter 8 Solutions
ALEKS 360; 18WKS F/ GEN. CHEMISTRY >I<
Additional Science Textbook Solutions
Fundamentals of Anatomy & Physiology (11th Edition)
Organic Chemistry
Loose Leaf For Integrated Principles Of Zoology
Campbell Biology: Concepts & Connections (9th Edition)
Physical Universe
- Identifying the major species in weak acid or weak base equilibria The preparations of two aqueous solutions are described in the table below. For each solution, write the chemical formulas of the major species present at equilibrium. You can leave out water itself. Write the chemical formulas of the species that will act as acids in the 'acids' row, the formulas of the species that will act as bases in the 'bases' row, and the formulas of the species that will act as neither acids nor bases in the 'other' row. You will find it useful to keep in mind that HCN is a weak acid. acids: 0.29 mol of NaOH is added to 1.0 L of a 1.2M HCN solution. bases: ☑ other: 0.09 mol of HCl is added to acids: 1.0 L of a solution that is bases: 0.3M in both HCN and KCN. other: 0,0,... ? 00. 18 Ar 日arrow_forwardIdentifying the major species in weak acid or weak base equilibria The preparations of two aqueous solutions are described in the table below. For each solution, write the chemical formulas of the major species present at equilibrium. You can leave out water itself. Write the chemical formulas of the species that will act as acids in the 'acids' row, the formulas of the species that will act as bases in the 'bases' row, and the formulas of the species that will act as neither acids nor bases in the 'other' row. You will find it useful to keep in mind that HF is a weak acid. acids: 0.2 mol of KOH is added to 1.0 L of a 0.5 M HF solution. bases: Х other: ☐ acids: 0.10 mol of HI is added to 1.0 L of a solution that is 1.4M in both HF and NaF. bases: other: ☐ 0,0,... ด ? 18 Ararrow_forwardIdentifying the major species in weak acid or weak base equilibria The preparations of two aqueous solutions are described in the table below. For each solution, write the chemical formulas of the major species present at equilibrium. You can leave out water itself. Write the chemical formulas of the species that will act as acids in the 'acids' row, the formulas of the species that will act as bases in the 'bases' row, and the formulas of the species that will act as neither acids nor bases in the 'other' row. You will find it useful to keep in mind that NH3 is a weak base. acids: ☐ 1.8 mol of HCl is added to 1.0 L of a 1.0M NH3 bases: ☐ solution. other: ☐ 0.18 mol of HNO3 is added to 1.0 L of a solution that is 1.4M in both NH3 and NH₁Br. acids: bases: ☐ other: ☐ 0,0,... ? 000 18 Ar B 1arrow_forward
- Using reaction free energy to predict equilibrium composition Consider the following equilibrium: 2NH3 (g) = N2 (g) +3H₂ —N2 (g) AGº = 34. kJ Now suppose a reaction vessel is filled with 4.19 atm of ammonia (NH3) and 9.94 atm of nitrogen (N2) at 378. °C. Answer the following questions about this system: rise Under these conditions, will the pressure of NH 3 tend to rise or fall? ☐ x10 fall Х Is it possible to reverse this tendency by adding H₂? In other words, if you said the pressure of NH 3 will tend to rise, can that be changed to a tendency to fall by adding H₂? Similarly, if you said the pressure of NH3 will tend to fall, can that be changed to a tendency to rise by adding H₂? If you said the tendency can be reversed in the second question, calculate the minimum pressure of H₂ needed to reverse it. Round your answer to 2 significant digits. yes no atm 00. 18 Ar 무ㅎ ?arrow_forwardIdentifying the major species in weak acid or weak base equilibria The preparations of two aqueous solutions are described in the table below. For each solution, write the chemical formulas of the major species present at equilibrium. You can leave out water itself. Write the chemical formulas of the species that will act as acids in the 'acids' row, the formulas of the species that will act as bases in the 'bases' row, and the formulas of the species that will act as neither acids nor bases in the 'other' row. You will find it useful to keep in mind that HF is a weak acid. 2.2 mol of NaOH is added to 1.0 L of a 1.4M HF solution. acids: П bases: Х other: ☐ ப acids: 0.51 mol of KOH is added to 1.0 L of a solution that is bases: 1.3M in both HF and NaF. other: ☐ 00. 18 Ararrow_forwardUsing reaction free energy to predict equilibrium composition Consider the following equilibrium: N2O4 (g) 2NO2 (g) AG⁰ = 5.4 kJ Now suppose a reaction vessel is filled with 1.68 atm of dinitrogen tetroxide (N204) at 148. °C. Answer the following questions about this system: rise Under these conditions, will the pressure of N2O4 tend to rise or fall? x10 fall Is it possible to reverse this tendency by adding NO2? In other words, if you said the pressure of N2O4 will tend to rise, can that be changed to a tendency to fall by adding NO2? Similarly, if you said the pressure of N2O4 will tend to fall, can that be changed to a tendency to rise by adding NO2? If you said the tendency can be reversed in the second question, calculate the minimum pressure of NO 2 needed to reverse it. Round your answer to 2 significant digits. yes no 0.42 atm ☑ 5 0/5 ? مله Ararrow_forward
- Homework 13 (Ch17) Question 4 of 4 (1 point) | Question Attempt: 2 of 2 ✓ 1 ✓ 2 = 3 4 Time Remaining: 4:25:54 Using the thermodynamic information in the ALEKS Data tab, calculate the standard reaction free energy of the following chemical reaction: 2CH3OH (g)+302 (g) → 2CO2 (g) + 4H₂O (g) Round your answer to zero decimal places. ☐ kJ x10 ☐ Subm Check 2020 Hill LLC. All Rights Reserved. Terms of Use | Privacy Cearrow_forwardIdentifying the major species in weak acid or weak base equilibria Your answer is incorrect. • Row 2: Your answer is incorrect. • Row 3: Your answer is incorrect. • Row 6: Your answer is incorrect. 0/5 The preparations of two aqueous solutions are described in the table below. For each solution, write the chemical formulas of the major species present at equilibrium. You can leave out water itself. Write the chemical formulas of the species that will act as acids in the 'acids' row, the formulas of the species that will act as bases in the 'bases' row, and the formulas of the species that will act as neither acids nor bases in the 'other' row. You will find it useful to keep in mind that HF is a weak acid. acids: HF 0.1 mol of NaOH is added to 1.0 L of a 0.7M HF solution. bases: 0.13 mol of HCl is added to 1.0 L of a solution that is 1.0M in both HF and KF. Exponent other: F acids: HF bases: F other: K 1 0,0,... ? 000 18 Ararrow_forwardUsing reaction free energy to predict equilibrium composition Consider the following equilibrium: 2NOCI (g) 2NO (g) + Cl2 (g) AGº =41. kJ Now suppose a reaction vessel is filled with 4.50 atm of nitrosyl chloride (NOCI) and 6.38 atm of chlorine (C12) at 212. °C. Answer the following questions about this system: ? rise Under these conditions, will the pressure of NOCI tend to rise or fall? x10 fall Is it possible to reverse this tendency by adding NO? In other words, if you said the pressure of NOCI will tend to rise, can that be changed to a tendency to fall by adding NO? Similarly, if you said the pressure of NOCI will tend to fall, can that be changed to a tendency to rise by adding NO? yes no If you said the tendency can be reversed in the second question, calculate the minimum pressure of NO needed to reverse it. Round your answer to 2 significant digits. 0.035 atm ✓ G 00. 18 Ararrow_forward
- Highlight each glycosidic bond in the molecule below. Then answer the questions in the table under the drawing area. HO- HO- -0 OH OH HO NG HO- HO- OH OH OH OH NG OHarrow_forward€ + Suppose the molecule in the drawing area below were reacted with H₂ over a platinum catalyst. Edit the molecule to show what would happen to it. That is, turn it into the product of the reaction. Also, write the name of the product molecule under the drawing area. Name: ☐ H C=0 X H- OH HO- H HO- -H CH₂OH ×arrow_forwardDraw the Haworth projection of the disaccharide made by joining D-glucose and D-mannose with a ẞ(1-4) glycosidic bond. If the disaccharide has more than one anomer, you can draw any of them. Click and drag to start drawing a structure. Xarrow_forward
 Chemistry: The Molecular ScienceChemistryISBN:9781285199047Author:John W. Moore, Conrad L. StanitskiPublisher:Cengage LearningChemistry: Matter and ChangeChemistryISBN:9780078746376Author:Dinah Zike, Laurel Dingrando, Nicholas Hainen, Cheryl WistromPublisher:Glencoe/McGraw-Hill School Pub Co
 General Chemistry - Standalone book (MindTap Cour...ChemistryISBN:9781305580343Author:Steven D. Gammon, Ebbing, Darrell Ebbing, Steven D., Darrell; Gammon, Darrell Ebbing; Steven D. Gammon, Darrell D.; Gammon, Ebbing; Steven D. Gammon; DarrellPublisher:Cengage Learning
 World of Chemistry, 3rd editionChemistryISBN:9781133109655Author:Steven S. Zumdahl, Susan L. Zumdahl, Donald J. DeCostePublisher:Brooks / Cole / Cengage Learning
 Chemistry: Principles and PracticeChemistryISBN:9780534420123Author:Daniel L. Reger, Scott R. Goode, David W. Ball, Edward MercerPublisher:Cengage Learning
 ChemistryChemistryISBN:9781305957404Author:Steven S. Zumdahl, Susan A. Zumdahl, Donald J. DeCostePublisher:Cengage Learning


