
The standard score for each of the score by SPSS and manually given in the data set.
Answer to Problem 7TP
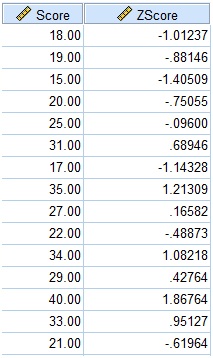
Fig (1)
The Z score for each scores obtained manual is shown in table below.
| Z score | |||
| 18 | 59.8044 | ||
| 19 | 45.3378 | ||
| 15 | 115.204 | ||
| 20 | 32.8711 | ||
| 25 | 0.53778 | ||
| 31 | 5.26667 | 27.7378 | |
| 17 | 76.2711 | ||
| 35 | 9.26667 | 85.8711 | |
| 27 | 1.26667 | 1.60444 | |
| 22 | 13.9378 | ||
| 34 | 8.26667 | 68.3378 | |
| 29 | 3.26667 | 10.6711 | |
| 40 | 14.2667 | 203.538 | |
| 33 | 7.26667 | 52.8044 | |
| 21 | 22.4044 | ||
| Total | 816.933 |
Fig (2)
The above both tables show same Z scores for each of the score.
Explanation of Solution
Given info:
The data set is given as follows:
| Score |
| 18 |
| 19 |
| 15 |
| 20 |
| 25 |
| 31 |
| 17 |
| 35 |
| 27 |
| 22 |
| 34 |
| 29 |
| 40 |
| 33 |
| 21 |
Calculation:
A z-score is the quantity of standard deviations from the mean an information point is. In any case, more in fact it's a measure of what numbers of standard deviations underneath or over the populace mean a crude score is. A z-score is otherwise called a standard score.
Step by step procedure to obtain the Z score using SPSS software is given below:
Steps for calculating Z score in SPSS:
- Go to Variable View, in first row write Score and come back to Data View.
- Click Analyze
Descriptive Statistics - Double click on the variable score to move it to the variables
- Click ok.
- The output will be as shown below.
Output using the SPSS software is given below:
Fig (1)
The above table shows the Z score corresponding to the each score.
The formula to calculate Z score is,
Mean:
The formula to calculate mean is,
Substitute 386 for
The formula to calculate sample standard deviation is,
Substitute 816.933 for
Use sample standard deviation for calculating of Z score and make a table of values.
| Z score | |||
| 18 | 59.8044 | ||
| 19 | 45.3378 | ||
| 15 | 115.204 | ||
| 20 | 32.8711 | ||
| 25 | 0.53778 | ||
| 31 | 5.26667 | 27.7378 | |
| 17 | 76.2711 | ||
| 35 | 9.26667 | 85.8711 | |
| 27 | 1.26667 | 1.60444 | |
| 22 | 13.9378 | ||
| 34 | 8.26667 | 68.3378 | |
| 29 | 3.26667 | 10.6711 | |
| 40 | 14.2667 | 203.538 | |
| 33 | 7.26667 | 52.8044 | |
| 21 | 22.4044 | ||
| Total | 816.933 |
Fig (1)
There is no difference of Z score whether Z score calculated by SPSS and manually.
Want to see more full solutions like this?
Chapter 8 Solutions
EBK STATISTICS FOR PEOPLE WHO (THINK TH

- Show how you get critical values of 1.65, -1.65, and $1.96 for a right-tailed, left- tailed, and two-tailed hypothesis test (use a = 0.05 and assume a large sample size).arrow_forwardSuppose that a sports reporter claims the average football game lasts 3 hours, and you believe it's more than that. Your random sample of 35 games has an average time of 3.25 hours. Assume that the population standard deviation is 1 hour. Use a = 0.05. What do you conclude?arrow_forwardSuppose that a pizza place claims its average pizza delivery time is 30 minutes, but you believe it takes longer than that. Your sample of 10 pizzas has an average delivery time of 40 minutes. Assume that the population standard deviation is 15 minutes and the times have a normal distribution. Use a = 0.05. a. What are your null and alternative hypotheses? b. What is the critical value? c. What is the test statistic? d. What is the conclusion?arrow_forward
- Table 5: Measurement Data for Question 9 Part Number Op-1, M-1 Op-1, M-2 | Op-2, M-1 Op-2, M-2 | Op-3, M-1 Op-3, M-2 1 21 20 20 20 19 21 2 24 23 24 24 23 24 3 4 5 6 7 8 9 10 11 21 12 8222332 201 21 20 22 20 22 27 27 28 26 27 28 19 18 19 21 24 21 22 19 17 18 24 23 25 25 23 26 20 20 18 19 17 13 23 25 25 2 3 3 3 3 2 3 18 18 21 21 23 22 24 22 20 19 23 24 25 24 20 21 19 18 25 25 14 24 24 23 25 24 15 29 30 30 28 31 16 26 26 25 26 25 17 20 20 19 20 20 843882388 20 18 25 20 19 25 25 30 27 20 18 19 21 19 19 21 23 19 25 26 25 24 25 25 20 19 19 18 17 19 17 Question 9 A measurement systems experiment involving 20 parts, three operators (Op-1, Op-2, Op-3), and two measure- ments (M-1, M-2) per part is shown in Table 5. (a) Estimate the repeatability and reproducibility of the gauge. (b) What is the estimate of total gauge variability?" (c) If the product specifications are at LSL = 6 and USL 60, what can you say about gauge capability?arrow_forwardQuestion 5 A fraction nonconforming control chart with center line 0.10, UCL = 0.19, and LCL = 0.01 is used to control a process. (a) If three-sigma limits are used, find the sample size for the control charte 2 (b) Use the Poisson approximation to the binomial to find the probability of type I error. (c) Use the Poisson approximation to the binomial to find the probability of type II error if the process fraction defective is actually p = 0.20.arrow_forwardQuestion 8 Ten parts are measured three times by the same operator in a gauge capability study. The data are shown in Table 4. (a) Describe the measurement error that results from the use of this gauge. I (b) Estimate total variability and product variability. (c) What percentage of total variability is due to the gauge? (d) If specifications on the part are at 100±15, find the P/T ratio for this gauge. Comment on the adequacy of the gauge. 3 Table 4: Measurement Data for Question 8 Part Number Measurement 1 Measurement 2 Measurement 3 1 2 100 95 101 100 93 97 3 101 103 100 4 96 95 97 5 98 98 96 6 99 98 98 7889 95 97 98 100 99 98 100 100 97 10 100 98 98 99arrow_forward
- Question 6 The data shown in Table 3 are and R values for 24 samples of size n = 5 taken from a process producing bearings. The measurements are made on the inside diameter of the bearing, with only the last three decimals recorded (i.e., 34.5 should be 0.50345). Perform a process capability analysis using and R charts for the data from Table 3. Table 3: Data for Question 6 Sample Number R | Sample Number I Ꭱ 1 34.5 3 13 35.4 8 2 34.2 4 14 34.0 6 ∞∞ 31.6 15 37.1 5 4 31.5 4 16 34.9 7 56789 35.0 5 17 33.5 4 34.1 6 18 31.7 3 32.6 4 19 34.0 8 33.8 3 20 35.1 4 34.8 7 10 33.6 8 11 31.9 3 12 38.6 9 2232 21 33.7 2 32.8 1 33.5 24 34.2 2 32 3arrow_forwardQuestion 1 The commercial loan operation of a financial institution has a standard for processing new loan applications in 24 hours. Table 1 shows the number of applications processed each day for the last 20 days and the number of applications that required more than 24 hours to complete. Table 1: Loan Application Data for Question 1 Day Applications Late Day Applications Late 1 200 3 11 219 0 2 250 4 12 238 10 3 240 2 13 250 4 4 300 5 14 302 6 5 200 2 15 219 20 6 250 4 16 246 3 7 246 3 17 251 6 8 258 5 18 273 7 9 275 2 19 245 3 10 274 1 20 260 (a) Set up the fraction nonconforming control chart for this process. Use the variable-width control limit approach. Plot the preliminary data in Table 1 on the chart. Is the process in statistical control? (b) Assume that assignable causes can be found for any out-of-control points on this chart. What center line should be used for process monitoring in the next period, and how should the control limits be calculated?arrow_forwardhelp me with ab please. please handwrite if possible. please don't use AI tools to answerarrow_forward
- help me with ab please. please handwrite if possible. please don't use AI tools to answerarrow_forwardhelp me with abcd please. please handwrite if possible. please don't use AI tools to answerarrow_forwardhelp me with abc please. please handwrite if possible. please don't use AI tools to answerarrow_forward
 MATLAB: An Introduction with ApplicationsStatisticsISBN:9781119256830Author:Amos GilatPublisher:John Wiley & Sons Inc
 Probability and Statistics for Engineering and th...StatisticsISBN:9781305251809Author:Jay L. DevorePublisher:Cengage Learning
 Statistics for The Behavioral Sciences (MindTap C...StatisticsISBN:9781305504912Author:Frederick J Gravetter, Larry B. WallnauPublisher:Cengage Learning
 Elementary Statistics: Picturing the World (7th E...StatisticsISBN:9780134683416Author:Ron Larson, Betsy FarberPublisher:PEARSON
 The Basic Practice of StatisticsStatisticsISBN:9781319042578Author:David S. Moore, William I. Notz, Michael A. FlignerPublisher:W. H. Freeman
 Introduction to the Practice of StatisticsStatisticsISBN:9781319013387Author:David S. Moore, George P. McCabe, Bruce A. CraigPublisher:W. H. Freeman