
Videos
1.
Compute estimated cost equation for delivery costs using high-low method.
1.
Explanation of Solution
Fixed Cost: Fixed cost refers the cost which remains constant for particular time duration and there is no effect on it of the level of production. For example, lease rental and interest on debts.
Compute variable cost.
Compute fixed cost.
Compute cost equation.
2.
Compute estimated cost equation for delivery costs using regression.
2.
Explanation of Solution
Summery output:
| Regression Statistics | |
| Multiple R | 0.910908263 |
| R square | 0.82975864 |
| Adjusted R square | 0.816658007 |
| Standard error | 9317.550058 |
| Observation | 15 |
Table (1)
| ANOVA | |||
| Particulars | df | SS | MS |
| Regression | 1 | 5500711165 | 5.50E+09 |
| Residual | 13 | 1128617608 | 86816739 |
| Total | 14 | 6629328773 | |
Table (2)
| Particulars | Coefficients | Standard error | t-star |
| Intercept | 18694.19925 | 19144.10277 | 0.976499 |
| Number of deliveries | 11.08553486 | 1.392672391 | 7.959901 |
Table (3)
Determine cost equation.
3.
Draw a graph to compute adjustments made to the regression analysis made in part 2.
3.
Explanation of Solution
Draw a graph to compute adjustments.
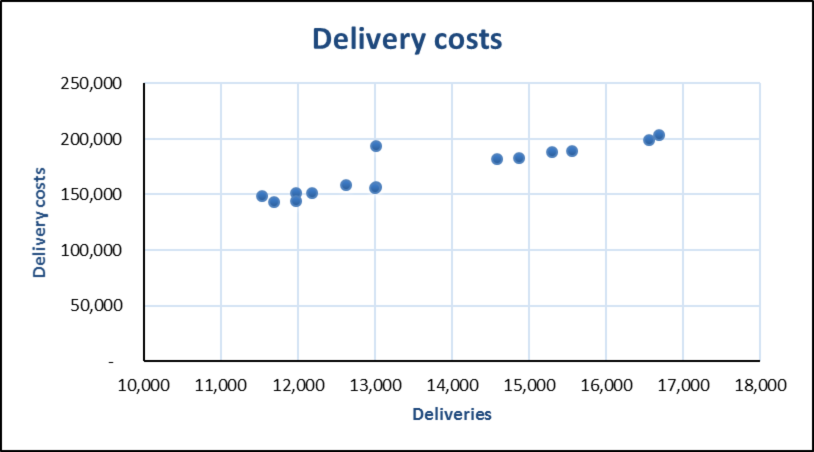
Figure (1)
The graph shows that observation 8 is an outlier. There are changes for error in recording the data or something unusual happened during those period. In any event data point affects the predictive ability of the regression analysis.
4.
Explain the conclusion about various cost equation.
4.
Explanation of Solution
In case of error in the data, it has to be rectified and regression analysis has to be rerun. If the data are accurate then the observation 8 should be estimated and dropped and rerun the regression. The results dropping the outlier is shown below:
Summary output:
| Regression Statistics | |
| Multiple R | 0.989929239 |
| R square | 0.979959898 |
| Adjusted R square | 0.97828989 |
| Standard error | 3174.447074 |
| Observation | 14 |
Table (4)
| ANOVA | |||
| Particulars | df | SS | MS |
| Regression | 1 | 5913244065 | 5.50E+09 |
| Residual | 12 | 120925370.7 | 10077114 |
| Total | 13 | 6034169436 | |
Table (5)
| Particulars | Coefficients | Standard error | t-star |
| Intercept | 10183.34352 | 6577.604102 | 1.5481843 |
| Number of deliveries | 11.54822861 | 0.476727891 | 24.223942 |
Table (6)
Compute cost equation.
In summary, the cost equations are:
High-low:
Regression with all data:
Regression without observation 8.
The controller has to be careful about use of cost equation to estimate delivery costs in the future. While R-squared of the first regression is high, the R-squared of the regression without outlier is higher. In second regression also the t-value is higher.
Want to see more full solutions like this?
Chapter 8 Solutions
COST MANAGEMENT (W/CONNECT ACCESS)(LOOS


- For the current year, Patterson Company incurred $218,000 in actual manufacturing overhead cost. The Manufacturing Overhead account showed that overhead was overapplied in the amount of $16,500 for the year. If the predetermined overhead rate was $11.75 per direct labor hour, how many direct labor hours were worked during the year?arrow_forwardFor the current year, Patterson Company incurred $218,000 in actual manufacturing overhead cost. The Manufacturing Overhead account showed that overhead was overapplied in the amount of $16,500 for the year. If the predetermined overhead rate was $11.75 per direct labor hour, how many direct labor hours were worked during the year? Need helparrow_forwardThe standard cost of Vibrant Sneakers includes 2.5 units of direct materials at $11.50 per unit. During September, the company buys 35,000 units of direct materials at $10.80 and uses those materials to produce 12,800 units. Compute the total, price, and quantity variances for materials.arrow_forward

 AccountingAccountingISBN:9781337272094Author:WARREN, Carl S., Reeve, James M., Duchac, Jonathan E.Publisher:Cengage Learning,
 Accounting Information SystemsAccountingISBN:9781337619202Author:Hall, James A.Publisher:Cengage Learning,
 Horngren's Cost Accounting: A Managerial Emphasis...AccountingISBN:9780134475585Author:Srikant M. Datar, Madhav V. RajanPublisher:PEARSON
 Intermediate AccountingAccountingISBN:9781259722660Author:J. David Spiceland, Mark W. Nelson, Wayne M ThomasPublisher:McGraw-Hill Education
 Financial and Managerial AccountingAccountingISBN:9781259726705Author:John J Wild, Ken W. Shaw, Barbara Chiappetta Fundamental Accounting PrinciplesPublisher:McGraw-Hill Education