
Videos
To write:
A
Answer to Problem 27E
Solution:
The file is,
%MATLAB code to load the data and create a data structure file.
%structure file.
stormdata = [321 2.4 1.5]
save stormdata.dat stormdata -ascii
stormdata = [111 3.3 12.1]
save stormdata.dat stormdata -ascii
clear
load stormdata.dat
%end of function file
%The function file should be placed in the same folder
The function file is,
%MATLAB code to print a table between stormdatavector and intensity.
%function file.
function tableprint(stormdatavector, intensity)
for i = 1:length(stormdatavector)
fprintf('%20.1f\t%20.1f\t%20.1f|t%20f\n', stormdatavector(i).locationcode, stormdatavector(i).rainfallamount, stormdatavector(i).stormduration, intensity(i))
end
end
%end of function file
%The function file should be placed in the same folder.
The function file is,
%MATLAB code to calculate the average intensity.
%function file.
function avgintensity(intensity)
intensitysum = 0;
for i = 1:length(intensity)
intensitysum = intensitysum + intensity(i);
end
avgintensity = intensitysum/length(intensity);
fprintf('Average intensity of storm is %f\n', avgintensity)
end
%end of function file
%The function file should be placed in the same folder.
The function file is,
%MATLAB code to find the information about mostintensestorm.
%function file.
function mostintensestorm(stormvector, intensity)
for i = 1:length(intensity)
for j = i + 1:length(intensity)
if intensity(i)>intensity(j)
temp = intensity(i);
intensity(i) = intensity (j);
intensity(j) = temp;
end
end
end
fprintf('the information of most intense storm is:%f\n', intensity(length(intensity)))
tempindex = index(stormvector, intensity);
fprintf('the index of most intense storm is:%d\n', tempindex);
fprintf('%20s|t%20s\t%20s\t%20s\n','location code','rainfall amount','storm duration','intensities')
fprintf('%20.1f\t%20.1f\t%20.1f\t%20f\n', stormvector(tempindex).locationcode, stormvector(tempindex).rainfallamount, stormvector(tempindex).stormduration, intensity(length(intensity)))
end
function index = index(stormvector, intensity)
for i = 1:length(stormvector)
if intensity(length(intensity)) ==stormvector(i).rainfallamount/stormvector(i).stormduration
index = i;
break;
end
end
end
%end of function file
%The function file should be placed in the same folder.
The function file is,
%MATLAB code to find the output.
%function file.
fprintf('%20s\t%20s\t%20s\t%20s\n','location code','rainfall amount','storm duration','intensities')
for i = 1:size(stormdata, 1)
for j = 1:length(stormdata(i))
stormvector(i) = struct('locationcode', stormdata(i, j),'rainfallamount', stormdata(i, j+1),'stormduration', stormdata(i, j+2));
intensity(i) = stormvector(i).rainfallamount/stormvector(i).stormduration;
end
end
tableprint(stormvector, intensity)
avgintensity(intensity)
mostintensestorm(stormvector, intensity)
%end of function file
%The function file should be placed in the same folder.
Explanation of Solution
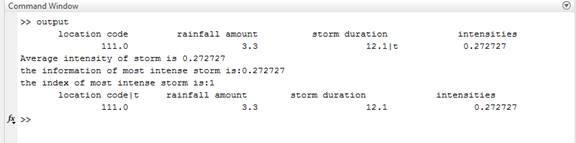
The output is,
The average intensity is,
The location code is,
The rainfall amount is,
MATLAB Code:
clc
clear all
close all
%MATLAB code to load the data and create a data structure file.
%structure file.
stormdata = [321 2.4 1.5]
save stormdata.dat stormdata -ascii
stormdata = [111 3.3 12.1]
save stormdata.dat stormdata -ascii
clear
load stormdata.dat
%end of structure file
%The file should be placed in the same folder
output;
%The function file should be placed in the same folder
%MATLAB code to print a table between stormdatavector and intensity.
%function file.
function tableprint(stormdatavector, intensity)
for i = 1:length(stormdatavector)
fprintf('%20.1f\t%20.1f\t%20.1f|t%20f\n', stormdatavector(i).locationcode, stormdatavector(i).rainfallamount, stormdatavector(i).stormduration, intensity(i))
end
end
%end of function file
%The function file should be placed in the same folder.
%MATLAB code to calculate the average intensity.
%function file.
function avgintensity(intensity)
intensitysum = 0;
for i = 1:length(intensity)
intensitysum = intensitysum + intensity(i);
end
avgintensity = intensitysum/length(intensity);
fprintf('Average intensity of storm is %f\n', avgintensity)
end
%end of function file
%The function file should be placed in the same folder.
%MATLAB code to find the information about mostintensestorm.
%function file.
function mostintensestorm(stormvector, intensity)
for i = 1:length(intensity)
for j = i + 1:length(intensity)
if intensity(i)>intensity(j)
temp = intensity(i);
intensity(i) = intensity (j);
intensity(j) = temp;
end
end
end
fprintf('the information of most intense storm is:%f\n', intensity(length(intensity)))
tempindex = index(stormvector, intensity);
fprintf('the index of most intense storm is:%d\n', tempindex);
fprintf('%20s|t%20s\t%20s\t%20s\n','location code','rainfall amount','storm duration','intensities')
fprintf('%20.1f\t%20.1f\t%20.1f\t%20f\n', stormvector(tempindex).locationcode, stormvector(tempindex).rainfallamount, stormvector(tempindex).stormduration, intensity(length(intensity)))
end
function index = index(stormvector, intensity)
for i = 1:length(stormvector)
if intensity(length(intensity)) ==stormvector(i).rainfallamount/stormvector(i).stormduration
index = i;
break;
end
end
end
%end of function file
%The function file should be placed in the same folder.
%MATLAB code to find the output.
%function file.
fprintf('%20s\t%20s\t%20s\t%20s\n','location code','rainfall amount','storm duration','intensities')
for i = 1:size(stormdata, 1)
for j = 1:length(stormdata(i))
stormvector(i) = struct('locationcode', stormdata(i, j),'rainfallamount', stormdata(i, j+1),'stormduration', stormdata(i, j+2));
intensity(i) = stormvector(i).rainfallamount/stormvector(i).stormduration;
end
end
tableprint(stormvector, intensity)
avgintensity(intensity)
mostintensestorm(stormvector, intensity)
%end of function file
%The function file should be placed in the same folder.
Save the MATLAB script with name, chapter8_54793_8_27E.m and function files with names tableprint.m, avgintensity.m, mostintensestorm.m and output.m in the current folder. Execute the functions by typing the functions name at the command window to generate output.
Result:
The result is,
Therefore, the result is stated above.
Want to see more full solutions like this?
Chapter 8 Solutions
MATLAB: A Practical Introduction to Programming and Problem Solving


- The following data represent total ventilation measured in liters of air per minute per square meter of body area for two independent (and randomly chosen) samples. Analyze these data using the appropriate non-parametric hypothesis testarrow_forwardeach column represents before & after measurements on the same individual. Analyze with the appropriate non-parametric hypothesis test for a paired design.arrow_forwardShould you be confident in applying your regression equation to estimate the heart rate of a python at 35°C? Why or why not?arrow_forward
- Given your fitted regression line, what would be the residual for snake #5 (10 C)?arrow_forwardCalculate the 95% confidence interval around your estimate of r using Fisher’s z-transformation. In your final answer, make sure to back-transform to the original units.arrow_forwardCalculate Pearson’s correlation coefficient (r) between temperature and heart rate.arrow_forward
 Algebra: Structure And Method, Book 1AlgebraISBN:9780395977224Author:Richard G. Brown, Mary P. Dolciani, Robert H. Sorgenfrey, William L. ColePublisher:McDougal Littell
 Elementary Geometry For College Students, 7eGeometryISBN:9781337614085Author:Alexander, Daniel C.; Koeberlein, Geralyn M.Publisher:Cengage,