
Concept explainers
a.
To determine: The average
Risk and Return:
The risk and return are two closely related terms. The risk is the uncertainty attached to an event. In case of any investment, there is some amount of risk attached to it as there can be either gain or loss. While return in the financial term is that percentage which represents the profit in an investment.
Higher risk is associated with higher return and lower risk has a probability of lower return. The investor has to face a tradeoff between risk and return in terms of an investment.
Annual Rate of Return:
The annual rate of return refers to that return which is charged or is earned on an investment for a year. This rate is expressed in percentage.
a.
Answer to Problem 22SP

Explanation of Solution
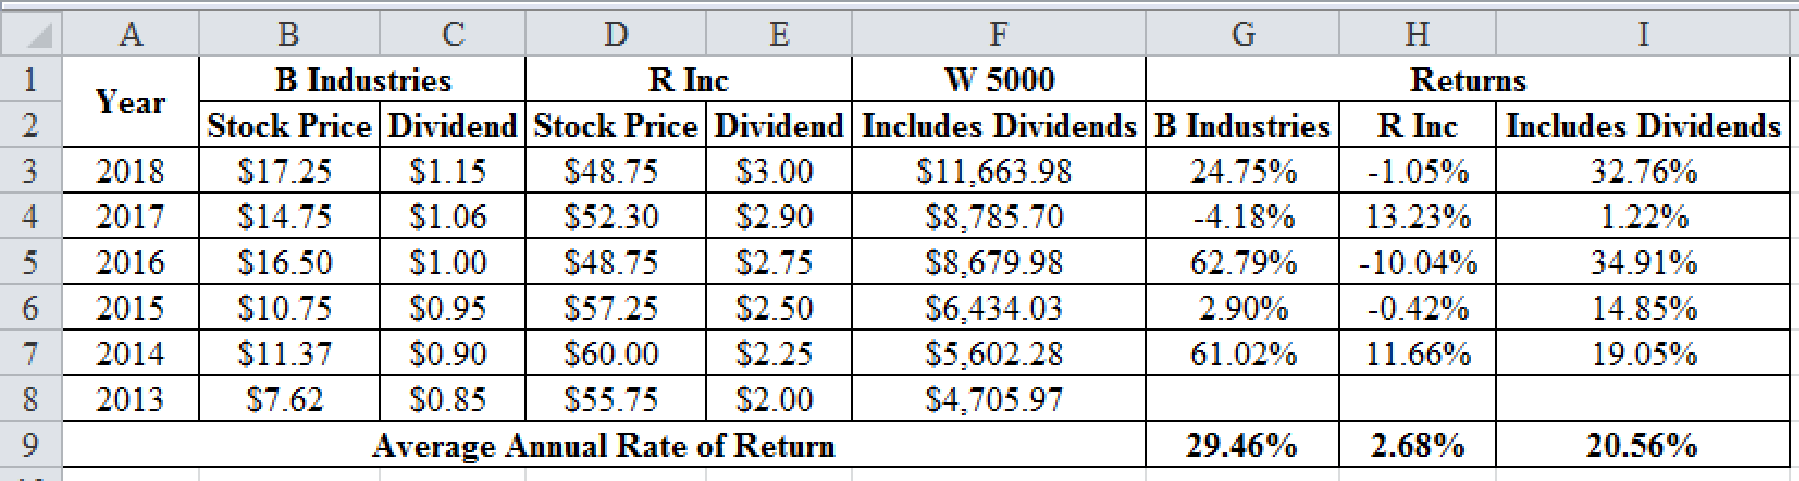
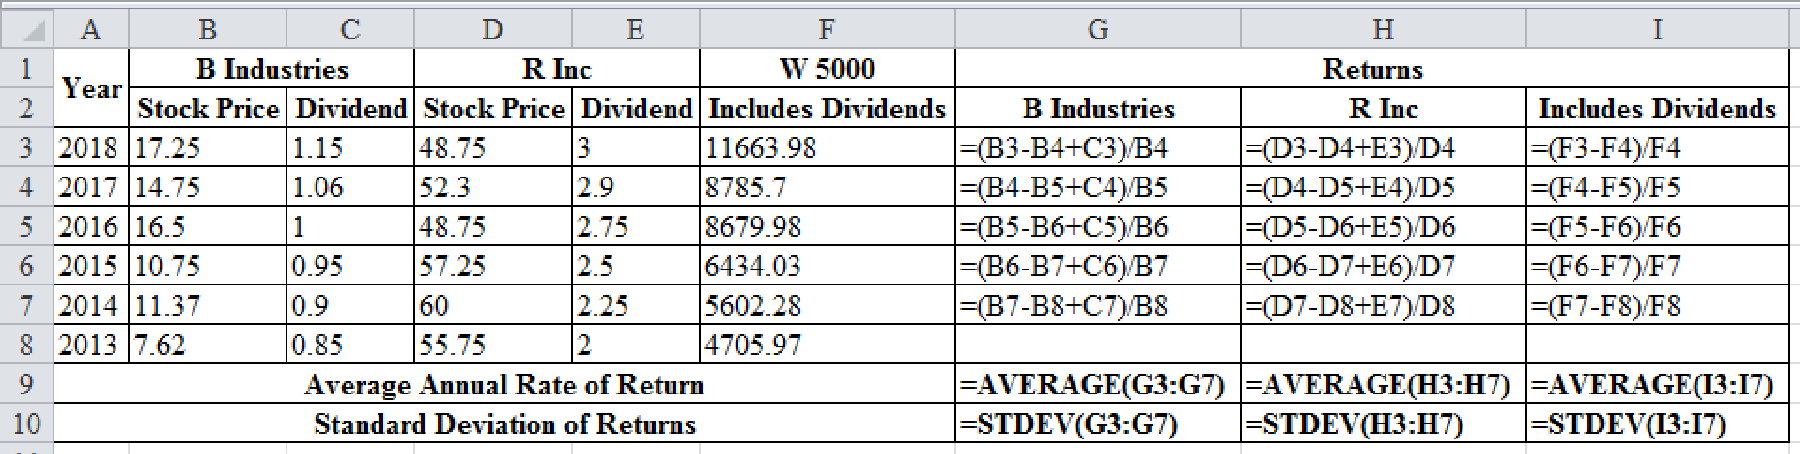
Calculation of annual rates of return in the excel spreadsheet:
Excel Spreadsheet:
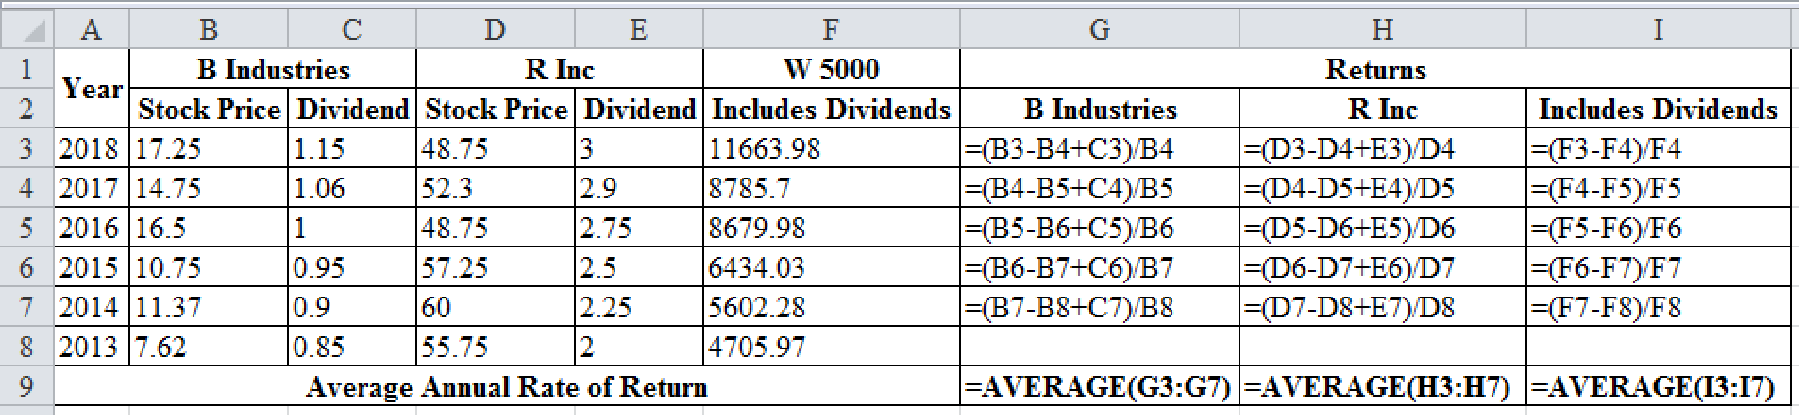
Excel Workings:
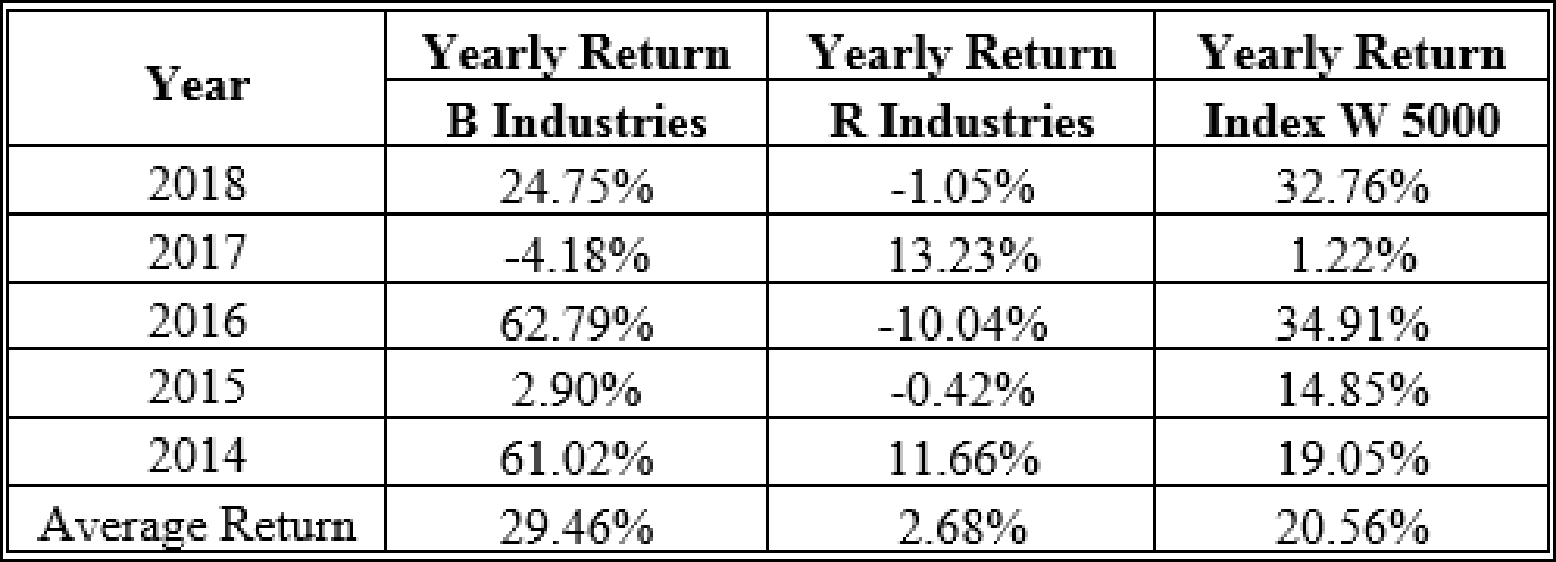
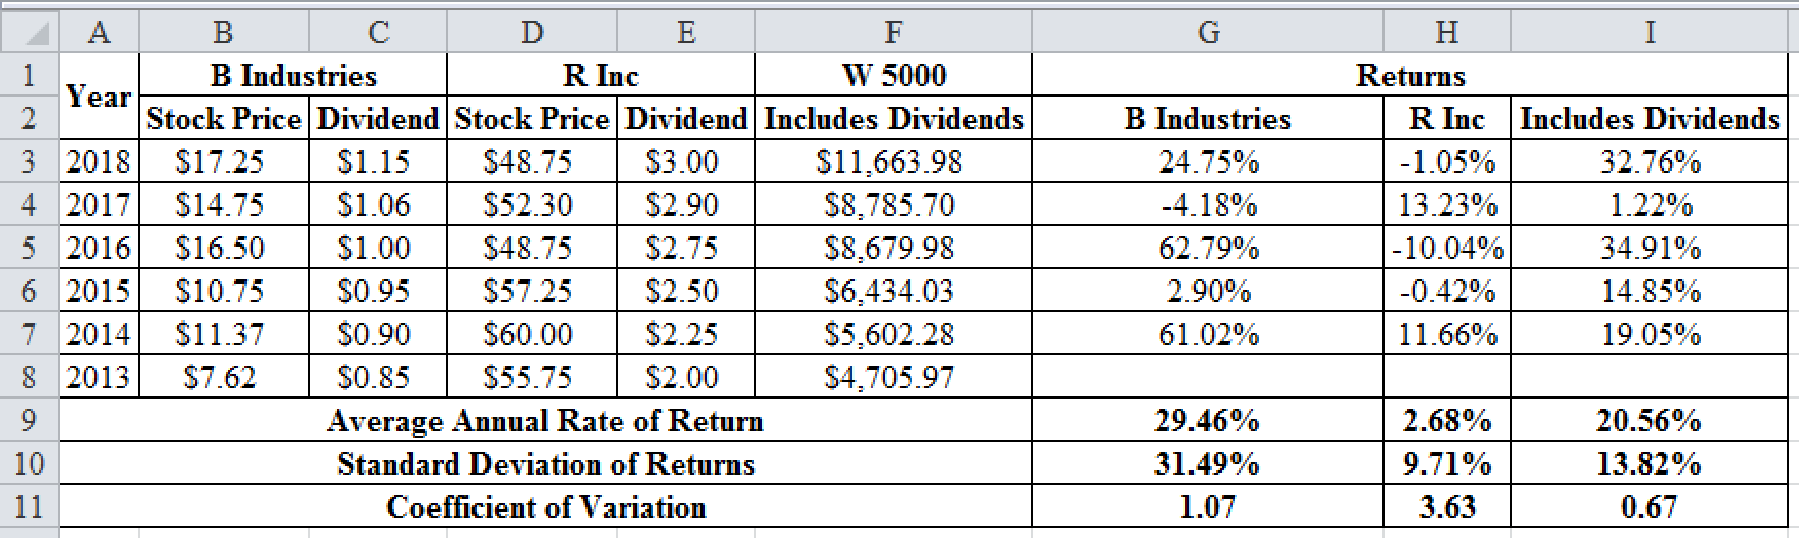
Therefore the yearly returns and average returns are as follows,
b.
To prepare: The standard deviation for the given data.
Standard deviation:
The standard deviation refers to the stand-alone risk associated with the securities. It measures how much a data is dispersed with its standard value. The Greek letter sigma represents the standard deviation.
b.
Answer to Problem 22SP
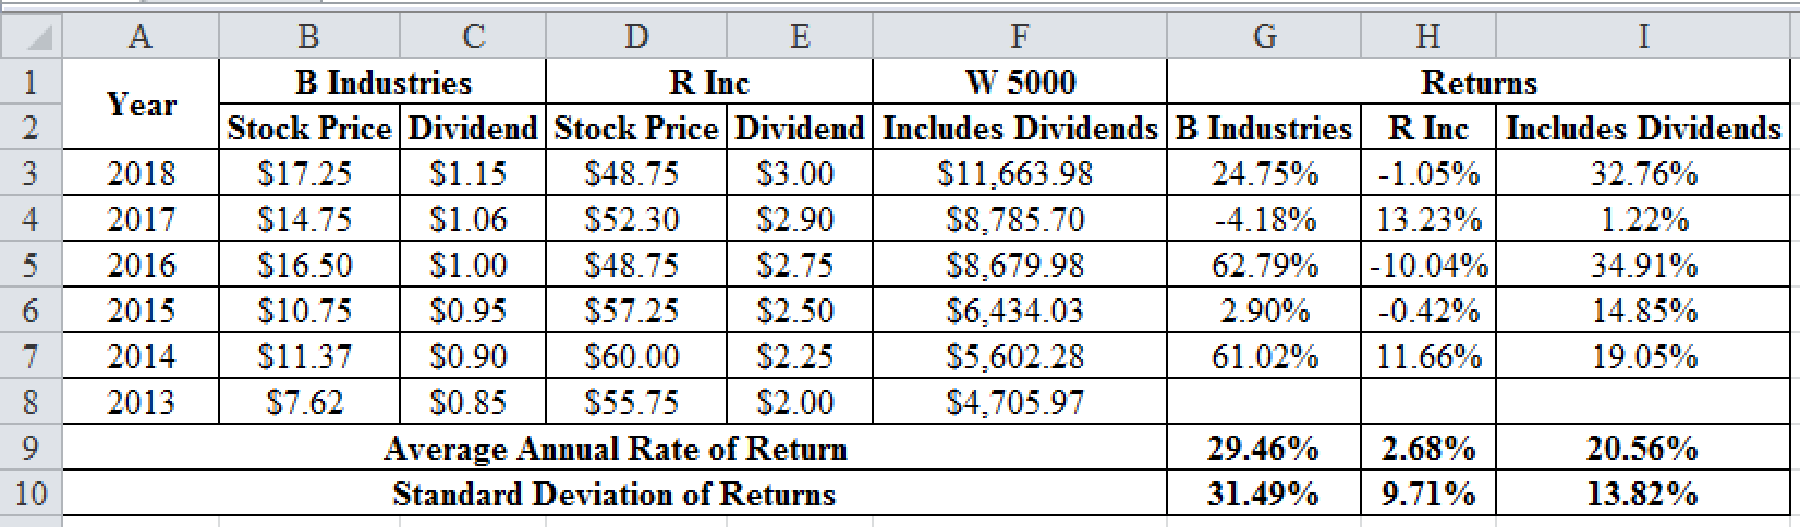
The standard deviation of B industries is 31.49%, R industries are 9.71% and Index W 5000 is 13.82%.
Explanation of Solution
Calculation of standard deviation with a excel spreadsheet:
Excel Spreadsheet:
Excel Workings:
Therefore the standard deviation of B industries is 31.49%, R industries are 9.71% and Index W 5000 is 13.82%.
c.
To determine: The coefficient of variation.
The coefficient of variation:
The coefficient of variation is a tool to determine the risk. It determines the risk per unit of return. It is used for measurement when the expected returns are same for two data.
c.
Answer to Problem 22SP
The coefficient of variation of B industries is 1.07, R industries are 3.63 and Index W 5000 is 0.67.
Explanation of Solution
The calculations of the coefficient of variation for the given data is shown below using excel:
Excel Spreadsheet:
Excel Workings:
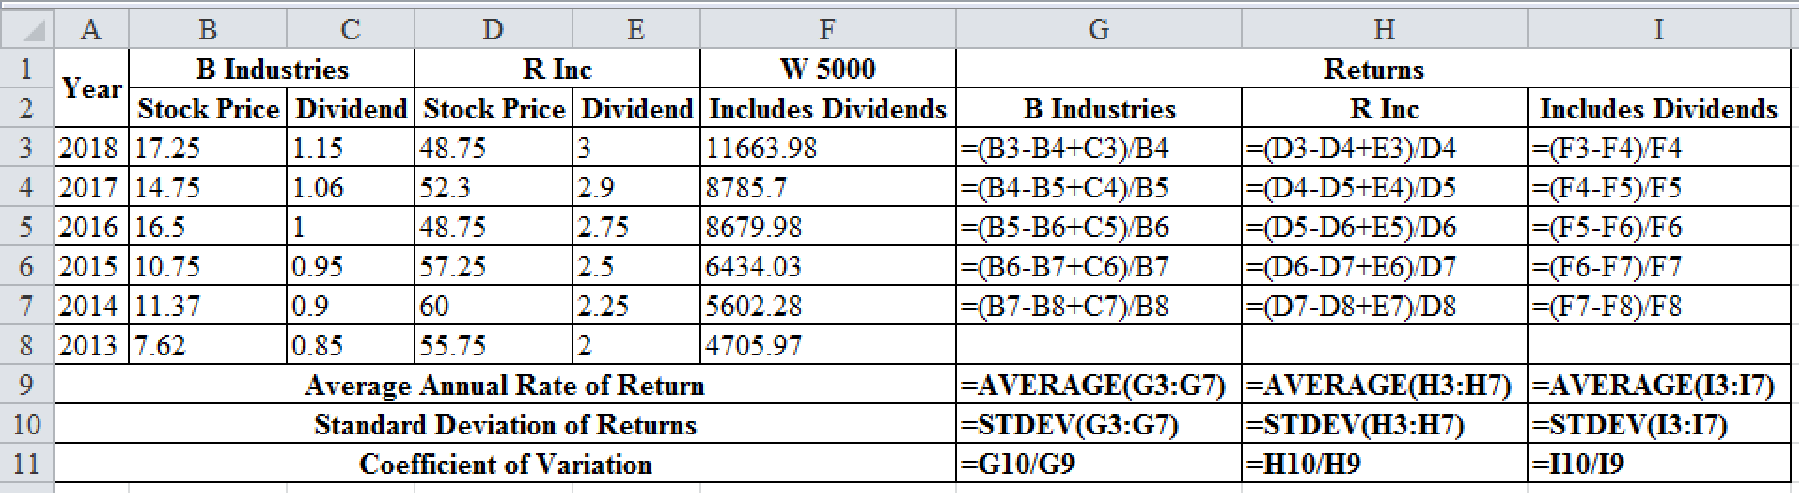
Therefore the coefficient of variation of B industries is 1.07, R industries are 3.63 and Index W 5000 is 0.67.
d.
To determine: The Sharpe ratio.
d.
Answer to Problem 22SP
The Sharpe ratio of B industries is 0.84, R industries are -0.03 and Index W 5000 is 1.27.
Explanation of Solution
Calculate the Sharpe Ratio for each company:
Therefore the Sharpe ratio of B industries is 0.84, R industries are -0.03 and Index W 5000 is 1.27.
e.
To prepare: A scatter diagram showing the company’s returns and the index returns.
e.
Explanation of Solution
The scatter diagram is as shown below:
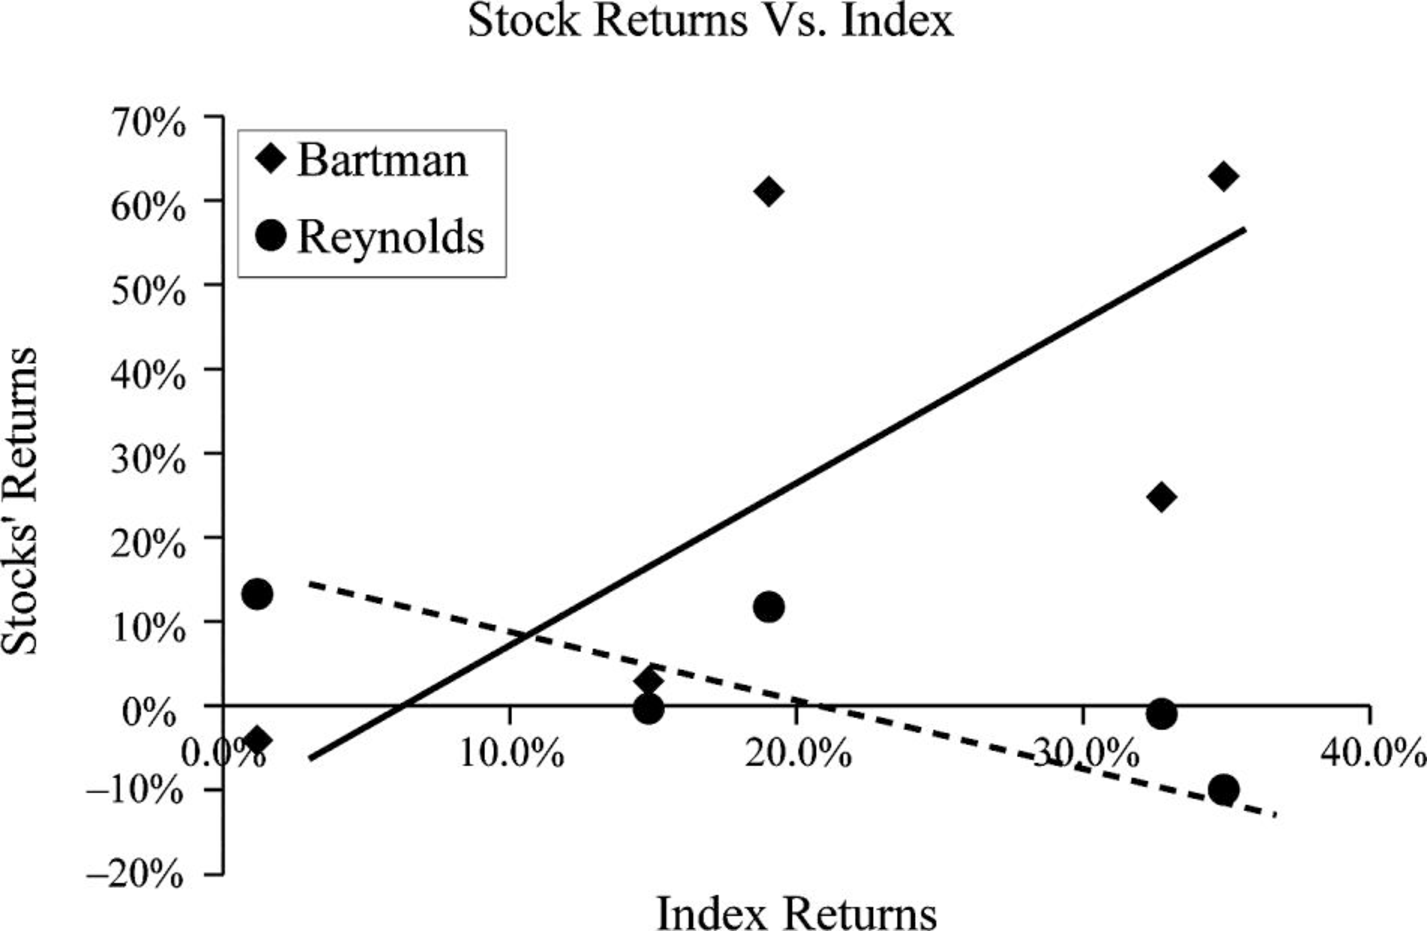
Graph (1)
- The blue line represents the B Industries and the red line represents the R Inc. and green lone represents the Index W 5000.
f.
To determine: The beta of the B Industries and R Inc. by running regressions of their returns.
f.
Answer to Problem 22SP
The beta of B industries is 1.53, R industries are -0.56.
Explanation of Solution
The beta of the B Industries, R Inc. and W 5000 by running regressions of their returns is:
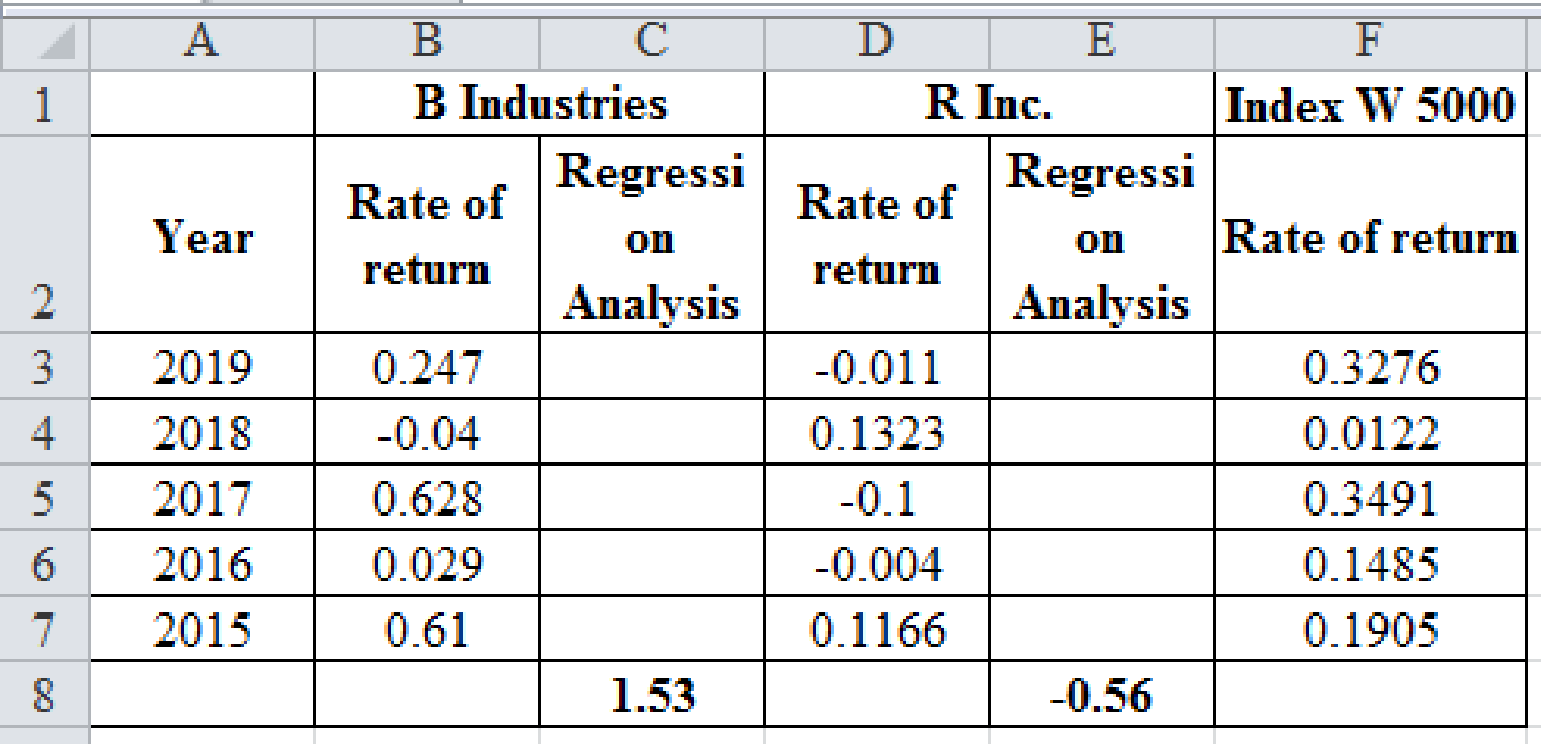
Therefore the beta of B industries is 1.53, R industries are -0.56.
g.
To determine: The required returns of the two companies by security market line equation.
g.
Answer to Problem 22SP
The required return of B industries is 13.67%, R industries are -3.26%.
Explanation of Solution
Given,
The risk-free rate is 4.5%.
The expected return on market is 10%.
Calculation of the required return:
Therefore the required return of B industries is 12.97%, R industries are 1.42%.
h.
To determine: The beta and the required return for a newly constructed portfolio.
h.
Answer to Problem 22SP
The required return of portfolio is 7.20% and the portfolio beta is 0.49.
Explanation of Solution
Calculation of the beta and the required return for the new portfolio:
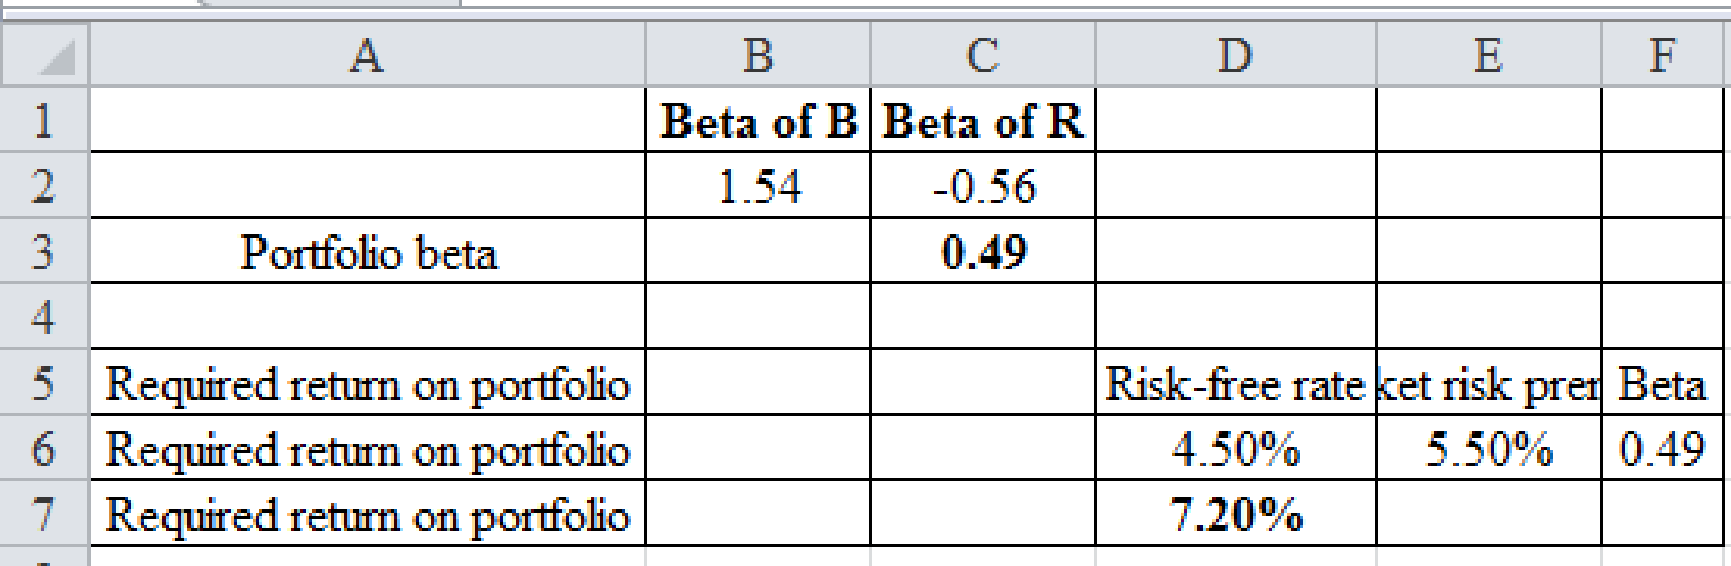
Therefore the required return of portfolio is 7.20% and the portfolio beta is 0.49.
i.
To determine: The new portfolio’s required return.
i.
Answer to Problem 22SP
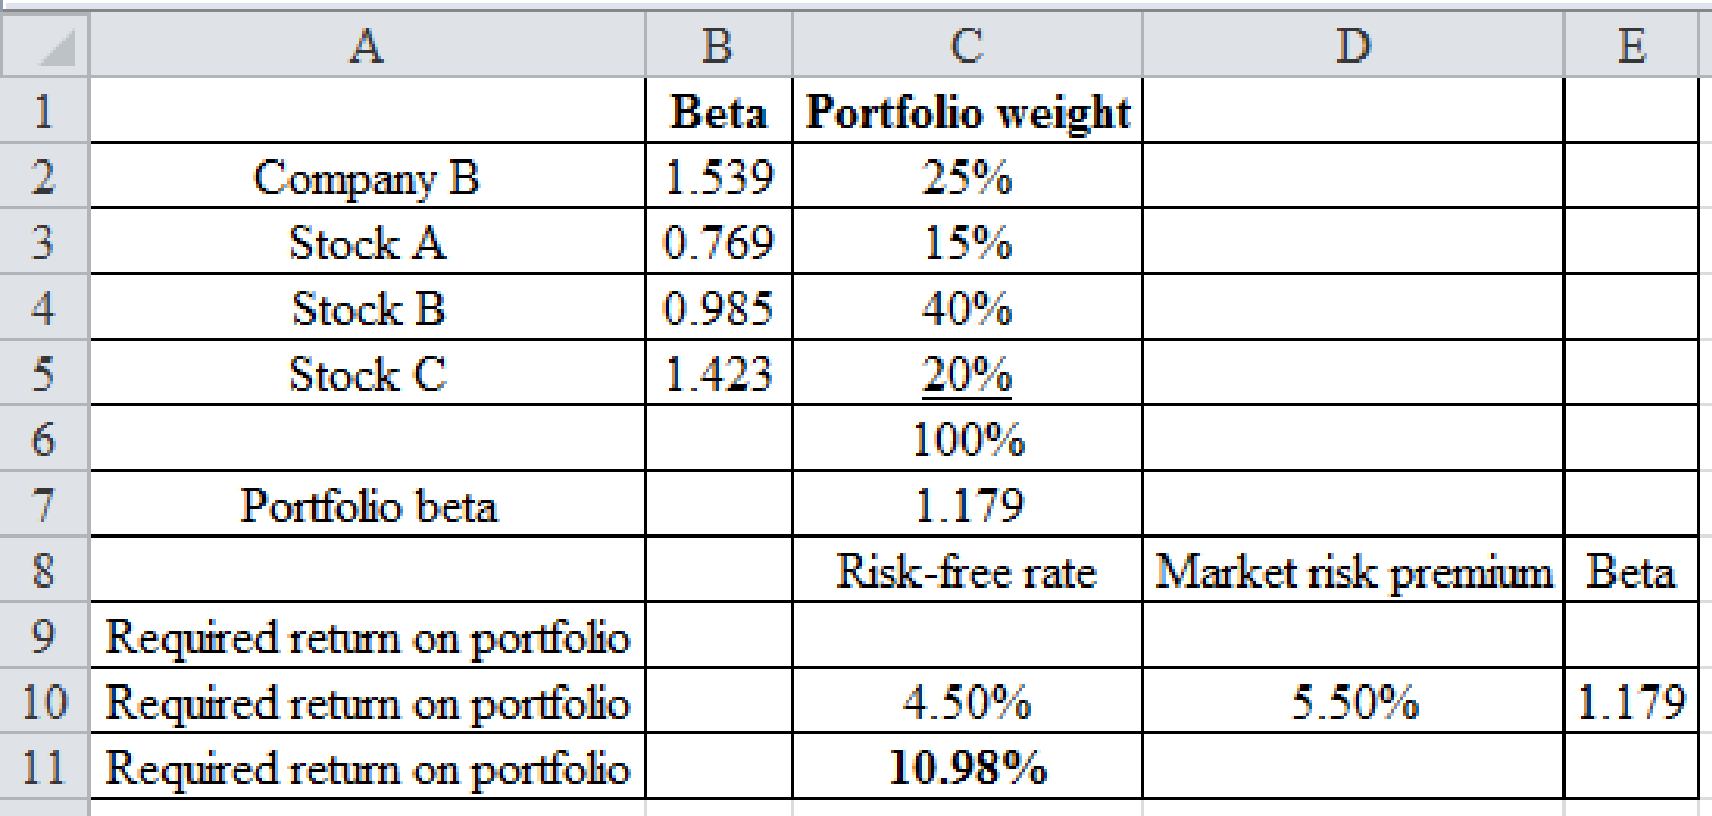
The new portfolio’s required return is 10.98%.
Explanation of Solution
Calculation of the required return on the portfolio:
Excel Spreadsheet:
Excel Workings:
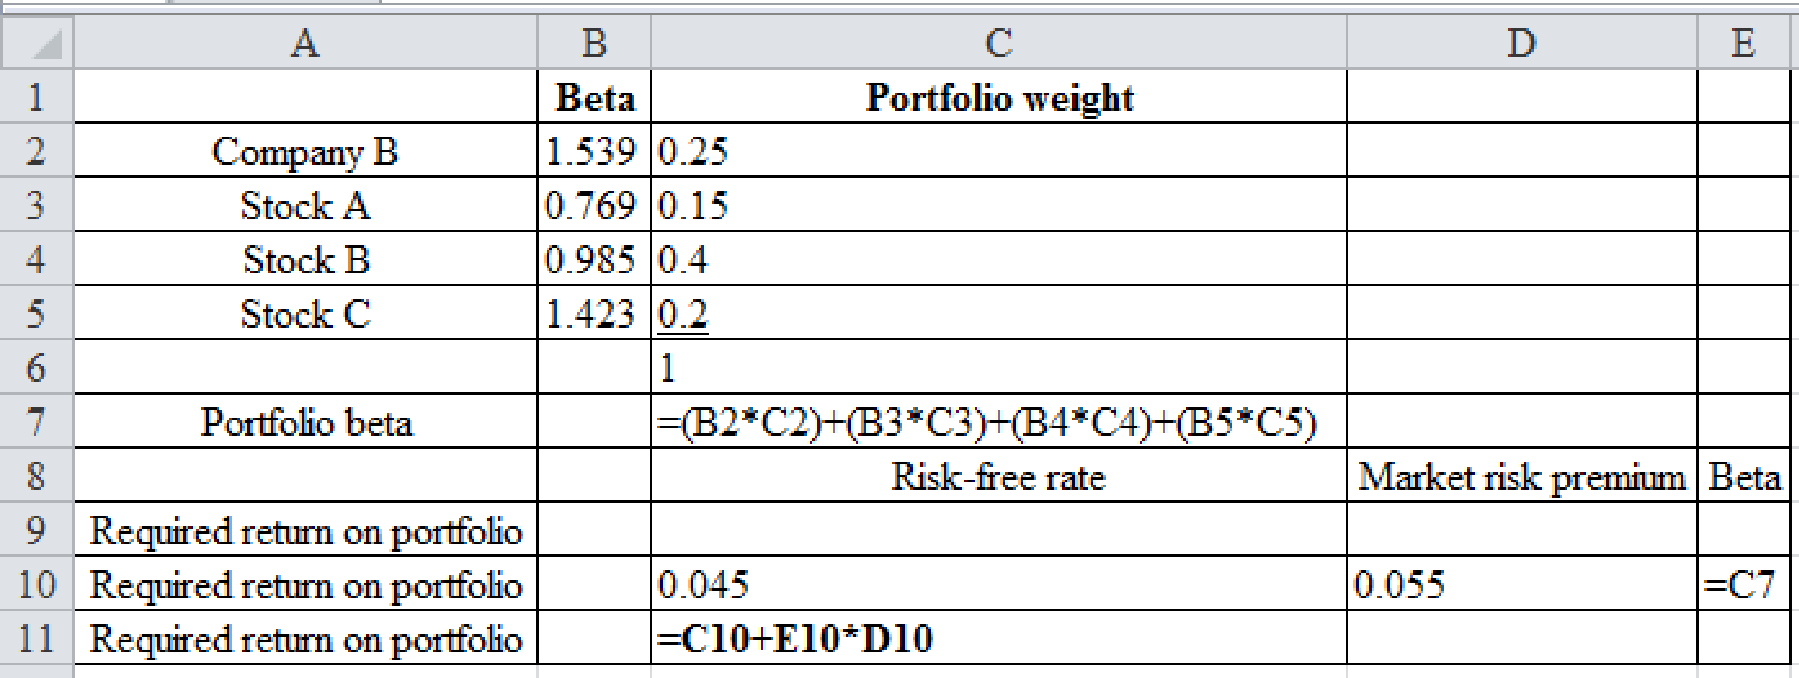
Therefore the new portfolio’s required return is 10.98%.
Want to see more full solutions like this?
Chapter 8 Solutions
FUND.OF FINANCIAL MGMT:CONCISE-MINDTAP


- Risk associated with a particular firm’s operating conditions is which of the following risk? a.Financial Risk b.Business Risk c.Liquidity Risk d.Interest Riskarrow_forwardThe discounted cash flow is which of the following approach? a.Forward approach b.Risk approach c.Earnings approach d.Backward approacharrow_forwardexplain The risk that arises due to use of debt by the firm causing variability of return for creditors and shareholders is: a.Liquidity Risk b.Call Risk c.Default Risk d.Financial Riskarrow_forward
- 53. A fixed cash flow in each year for a specified number of years is called as……. a.Annuity b.Compounding c.Reovery Factor d.Discountingarrow_forwardWhat is the full form of "NYSE"? a.Net uield Security Exchnage b.National Stock Exchange c.Net Asset Value d.New York Stock Exchnagearrow_forwardThe method of converting the amount of future cash into an amount of cash and cash equivalents value in present is known as: a.Annuity b.Compounding c.None of these d.Discountingarrow_forward
- The risk that arises due to use of debt by the firm causing variability of return for creditors and shareholders is: a.Liquidity Risk b.Call Risk c.Default Risk d.Financial Riskarrow_forward47. The value of holding period return is always show: a.Greater than 0 b.Less than 0 c.Negative d.Equal to 0arrow_forwardCurrent yield is equal to What? a.Market yield b.Any of these c.Income yield d.Running Yieldarrow_forward
- Explain. The financial activities which are performed regularly are known as: a.Recurring Finance b.None of these c.Non-recurring finance functions d.Both a and barrow_forwardThe risk in terms of variability in security’s total return due to some exogenous factors is known as: a.systematic risk b.Unsystematic risk c.None of these d.Non diversifiable riskarrow_forwardThe Wildcat Oil Company is trying to decide whether to lease or buy a new computer-assisted drilling system for its oil exploration business. Management has decided that it must use the system to stay competitive; it will provide $3 million in annual pretax cost savings. The system costs $8.9 million and will be depreciated straight-line to zero over five years. Wildcat's tax rate is 21 percent, and the firm can borrow at 7 percent. Lambert Leasing Company is willing to lease the equipment to Wildcat. Lambert's policy is to require its lessees to make payments at the start of the year. Suppose it is estimated that the equipment will I have an aftertax residual value of $900,000 at the end of the lease. What is the maximum lease payment acceptable to Wildcat? Note: Do not round intermediate calculations and enter your answer in dollars, not millions of dollars, rounded to 2 decimal places, e.g., 1,234,567.89. Maximum lease paymentarrow_forward
 Fundamentals Of Financial Management, Concise Edi...FinanceISBN:9781337902571Author:Eugene F. Brigham, Joel F. HoustonPublisher:Cengage Learning
 Financial Reporting, Financial Statement Analysis...FinanceISBN:9781285190907Author:James M. Wahlen, Stephen P. Baginski, Mark BradshawPublisher:Cengage Learning
 Fundamentals of Financial Management, Concise Edi...FinanceISBN:9781285065137Author:Eugene F. Brigham, Joel F. HoustonPublisher:Cengage Learning
 Fundamentals of Financial Management, Concise Edi...FinanceISBN:9781305635937Author:Eugene F. Brigham, Joel F. HoustonPublisher:Cengage Learning
 Fundamentals of Financial Management (MindTap Cou...FinanceISBN:9781285867977Author:Eugene F. Brigham, Joel F. HoustonPublisher:Cengage Learning