
Concept explainers
Videos
In Exercises 1–6, find the probability distribution for the given random variable and draw a histogram.
A couple has two children;
To calculate: The probability distribution for the random variable X, if there is a couple that has two children and X is a number of boys, assuming that the chances of a child being a boy or a girl are same.
Answer to Problem 1RE
Solution:
The probability distribution for a number of boys is:
Explanation of Solution
Given Information:
There is a couple that has two children and X is a number of boys, assuming that the chances of a child being a boy or a girl are the same.
Formula Used:
If n is the number of trials and X is the number of successes, then the probability for a particular value of X is given by:
Calculation:
Consider the number of children
Evaluate the probability of success which is the probability of a boy.
Evaluate the probability of failure which is the probability of a girl.
Possible values of X being a boy child are
Now estimate the probability of each value of n by applying the formula
Evaluate the probability
Evaluate the probability
Evaluate the probability
The probability distribution for the number of boys is,
Graph:
The steps to draw the histogram of the binomial distribution is
Step 1: Place x values on the horizontal axis.
Step2. Place the value of probability
Step3. Construct a bar over each value of x extending from
Draw the graph of the binomial distribution as follows:
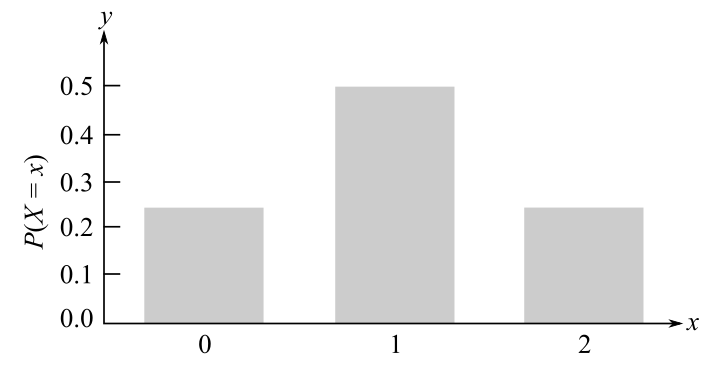
Interpretation:
The histogram of the probability distribution of a boy child out of two children where the probability of selecting a girl or boy child is equal.
Want to see more full solutions like this?
Chapter 8 Solutions
FINITE MATHEMATICS >PRINT UPGRADE<


- 8.6.2 Consider the natural frequency of beams described in Exercise 8.2.8. Compute a 90% prediction interval on the diameter of the natural frequency of the next beam of this type that will be tested. Compare the length of the prediction interval with the length of the 90% CI on the population mean. 8.6.3 Consider the television tube brightness test described in Exercise 8.2.7. Compute a 99% prediction interval on the brightness of the next tube tested. Compare the length of the prediction interval with the length of the 99% CI on the population mean.arrow_forwardAnswer question S8 stepwisearrow_forwardAnswer questions 8.2.11 and 8.2.12 respectivelyarrow_forward
- 8.4.2 An article in Knee Surgery, Sports Traumatology, Arthroscopy [“Arthroscopic Meniscal Repair with an Absorbable Screw: Results and Surgical Technique” (2005, Vol. 13, pp. 273–279)] showed that only 25 out of 37 tears (67.6%) located between 3 and 6 mm from the meniscus rim were healed. a. Calculate a two-sided 95% confidence interval on the proportion of such tears that will heal. b. Calculate a 95% lower confidence bound on the proportion of such tears that will heal. 8.4.3 An article in the Journal of the American Statistical Association [“Illustration of Bayesian Inference in Normal Data Models Using Gibbs Sampling” (1990, Vol. 85, pp. 972–985)] measured the weight of 30 rats under experiment controls. Suppose that 12 were underweight rats. a. Calculate a 95% two-sided confidence interval on the true proportion of rats that would show underweight from the experiment. b. Using the point estimate of p obtained from the preliminary sample, what sample size is needed to be 95%…arrow_forward8.4.8 Use the data from Exercise 8.4.2 to compute the two-sided Agresti-Coull CI on the proportion of tears that heal. Compare and discuss the relationship of this interval to the one computed in Exercise 8.4.2.arrow_forwardAnswer questions 8.3.7 and 8.4.1 respectivelyarrow_forward
- Don't do 14. Please solve 19arrow_forward8.4.7 Use the data from Exercise 8.4.5 to compute the two-sided Agresti-Coull CI on the proportion of digits read correctly. Compare and discuss the relationship of this interval to the one computed in Exercise 8.4.5.arrow_forward8.6.5 Consider the fuel rod enrichment data described in Exercise 8.2.11. Compute a 90% prediction interval on the enrichment of the next rod tested. Compare the length of the prediction interval with the length of the 99% CI on the population mean.arrow_forward
- 8.4.4 The Arizona Department of Transportation wishes to survey state residents to determine what proportion of the population would like to increase statewide highway speed limits from 65 mph to 75 mph. How many residents does the department need to survey if it wants to be at least 99% confident that the sample proportion is within 0.05 of the true proportion? 8.4.5 The U.S. Postal Service (USPS) has used optical character recognition (OCR) since the mid-1960s. In 1983, USPS began deploying the technology to major post offices throughout the country (www.britannica.com). Suppose that in a random sample of 500 handwritten zip code digits, 466 were read correctly. a. Construct a 95% confidence interval for the true proportion of correct digits that can be automatically read. b. What sample size is needed to reduce the margin of error to 1%? c. How would the answer to part (b) change if you had to assume that the machine read only one-half of the digits correctly?arrow_forwardAnswer questions 8S7 and 8S14arrow_forwardAnswer questions 8.2.9 and 8.2.10 respectivelyarrow_forward
 Holt Mcdougal Larson Pre-algebra: Student Edition...AlgebraISBN:9780547587776Author:HOLT MCDOUGALPublisher:HOLT MCDOUGAL