
To discuss:
Annual average return and standard deviation.
Introduction:
Return: In financial context, return is seen as percentage that represents the profit in an investment.
Explanation of Solution
The annual average
Using equation (1) the annual average return of Miller’s Fund (MF) is calculated as follows:
The annual average return of Miller’s Fund (MF) is 24.325%..
Using equation (1) the annual average return of S&P is calculated as follows:
The annual average return of S&P is 14.925%.
By the annual average returns, Miller’s Fund performed better than the S&P over the given period of time.
If money investment of $1,000 is made in Miller’s Fund in 2009, the money reaped at the end of 2012 would be $1,243.25
If money investment of $1,000 is made in S&P in 2009, the money reaped at the end of 2012 would be $1,149.25
The standard deviation of Miller’s Fund can be calculated as follows using excel functions as in table1.
Table 1
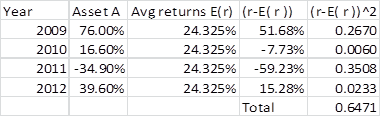
The standard deviation of Miller’s Fund is calculated as follows:
The standard deviation of Miller’s Fund is 46.44%.
The standard deviation of S&P can be calculated as follows using excel functions as in table 2.
Table 2
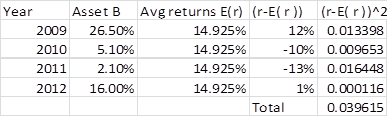
The standard deviation of S&P is calculated as follows:
The standard deviation of S&P is 11.5%.
By the value of standard deviation, Millers Fund is more volatile than S&P.
Want to see more full solutions like this?
Chapter 8 Solutions
PRINCIPLES OF MANAGERIAL FINANCE (SUBSCR

- finance subjectarrow_forwardCould you help explain, what is the complete salary survey analysis, and ensuring the data is relevant and up-to-date? What is the job evaluation and compensation plan? How to ensure the final report is comprehensive, clearly structured, and aligned with the company vision?arrow_forwardThe maturity value of an $35,000 non-interest-bearing, simple discount 4%, 120-day note is:arrow_forward
- Carl Sonntag wanted to compare what proceeds he would receive with a simple interest note versus a simple discount note. Both had the same terms: $18,905 at 10% for 4 years. Use ordinary interest as needed. Calculate the simple interest note proceeds. Calculate the simple discount note proceeds.arrow_forwardWhat you're solving for Solving for maturity value, discount period, bank discount, and proceeds of a note. What's given in the problem Face value: $55300 Rate of interest: 10% Length of note: 95 days Date of note: August 23rd Date note discounted: September 18th Bank discount rate:9 percentarrow_forwardAll tutor giving incorrect solnarrow_forward
 EBK CONTEMPORARY FINANCIAL MANAGEMENTFinanceISBN:9781337514835Author:MOYERPublisher:CENGAGE LEARNING - CONSIGNMENT
 Essentials of Business Analytics (MindTap Course ...StatisticsISBN:9781305627734Author:Jeffrey D. Camm, James J. Cochran, Michael J. Fry, Jeffrey W. Ohlmann, David R. AndersonPublisher:Cengage Learning