
Effect on cycle length due to
Answer to Problem 18P
Cycle length value increases with
Explanation of Solution
Given data:
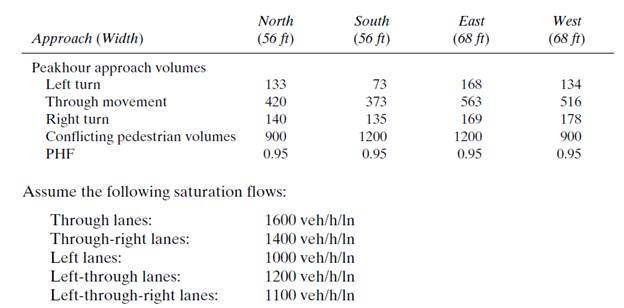
Calculation:
Evaluating equivalent hourly flow −
Similarly, evaluating equivalent hourly flow for all traffic movements −
Table 1
| Approach (width) | N (56ft) | S (56ft) | E (68ft) | W (68ft) |
| Left turn | 133/0.95 = 140 | 73/0.95 = 77 | 168/0.95 = 177 | 134/0.95 = 142 |
| Through movement | 443 | 393 | 593 | 544 |
| Right turn | 148 | 143 | 178 | 188 |
| Conflicting pedestrian volume | 948 | 1264 | 1264 | 948 |
Assuming lane configuration as one dedicated left turn and combined through and right lane −
Table 2
| Approach | N | S | E | W |
| Left | 140 | 77 | 177 | 142 |
| Through + Right | 589 (442+147) | 535 (393+178) | 771 (593+178) | 730 (543+187) |
Assume a phase scheme and find critical ratios(
Table 3
| - | Phase lE-W (Left) | Phase llE-W (Through) | Phase lllN-S (Left) | Phase lVN-S (Through) |
| 177 | 771 | 140 | 589 | |
| 1000 | 3000 (1600+1400) | 1000 | 3000 (1600+1400) | |
| 0.177 | 0.257 | 0.140 | 0.196 |
Sum of critical ratios −
Assuming lost time per phase (
So, Total lost time −
Now, determining the optimum cycle length −
(Cycle lengths are generally multiple of
Finding Total effective green time −
Effective time for phase
For Phase l
(Assuming yellow time as
For Phase ll
For Phase lll
For Phase lV
Table 4
| Phase | Allocated green & yellow time (in sec) |
Total cycle length
Green time required for pedestrian crossing can be calculated as following formula:
(Assuming the crosswalk width as
Where,
Calculating
Calculating minimum time required (
Minimum time required for N approach (
Minimum time required for S approach (
Minimum time required for E approach (
Minimum time required for W approach (
Table 5
| Phase | Minimum green time (in sec) |
Sum of green and yellow time is given by,
Total cycle length is given by,
Now increasing the pedestrian volume with
Table 6
| New conflicting pedestrian volume | 1138 | 1517 | 1517 | 1138 |
According to the new pedestrian volume calculating minimum time required by pedestrian for each approach:
Calculating
Calculating new minimum time required (
Minimum time required for N approach (
Minimum time required for S approach (
Minimum time required for E approach (
Minimum time required for W approach (
Comparing the
Selecting greater values in between both
Table 7
| Phase | New minimum green time (in sec) |
Sum of green and yellow time is given by,
Total new cycle length is given by,
Conclusion:
With using pedestrian volume flow rate
Want to see more full solutions like this?
Chapter 8 Solutions
Traffic And Highway Engineering

- Determine the bending moment at support A for the beam shown using the slope-deflection method. Use the sign convention defined in the chapter. a. 232.9 k-ft b. -182.1 k-ft c. 182.1 k-ft d. -232.9 k-ftarrow_forwardWhat is the shear and normal stresses of Point J and Point K?arrow_forwardWhat are the states of stress (magnitude and tension/compression of the normal stresses and shear stress) at Point J and Point K?arrow_forward
- Consider, M people (aka pax) who want to travel by car from O to D. They all start working at D at Q (e.g., Q-8am). If a person departs at time t, assume the time needed to go from O to D is given by c(t)=A+Bx(t), where x(t) is the flow of people departing at time t [car/unit of time]. In addition, a is the penalty for being early at work (E(t) is how early the person arrived when departing at time t), and ẞ is the penalty for being late at work (L(t) is how late the person arrived when departing at time t). Assume 0 < a < 1 < ß. Further assume the departure time choice problem under the equilibrium conditions. Prove that the arrival time of people who depart when most of the M people start their trips is equal to Q.arrow_forwarda. A b. A 3. Sketch normal depth, critical depth and the water surface profile. Assume at A and B the water is flowing at normal depth. Label and Identify all curves (i.e., M1, S2, etc.) Yn > Ye Уп Ye Уп> Ус yarrow_forward2. Design a trapezoidal ditch to carry Q = 1000 cfs. The ditch will be a lined channel, gravel bottom with sides shown below on a slope of S = 0.009. The side slopes of the 20-ft wide ditch will be 1 vertical to 3 horizontal. a) Determine the normal depth of flow (yn) using the Normal value for Manning's n. b) If freeboard requirements are 25% of the normal depth, how deep should the ditch be constructed? c) Classify the slope. T b Уп Z 1 Yn + FBarrow_forwardP15.45 WP A stainless steel pipe (Figure P15.45) with an outside diameter of 2.375 in. and a wall thickness of 0.109 in. is subjected to a bending moment M = 50 lb ft and an internal pressure of 180 psi. Determine the absolute maximum shear stress on the outer surface of the pipe. M FIGURE P15.45 Marrow_forward10.72 What power must the pump supply to the system to pump the oil from the lower reservoir to the upper reservoir at a rate of 0.3 m³/s? Sketch the HGL and the EGL for the system. p=940 kg/m³ v = 10-5 m²/s Elevation 100 m Elevation 112 m L= 150 m Oil Steel pipe D = 30 cm Problem 10.72arrow_forwardL / 83° 28° $75°E M 202° Q2: The scanning process was completed from point J to point N. The direction of the straight line was LM and the angles of deviation are shown in the figure below. Find the direction of the remaining sides? Narrow_forwardQ3: The scanning process was completed from point F to point G. The direction of the line Fl and the angles of deviation and interior are shown in the figure below. Find the direction of the remaining sides? Azimn = 60° F 52° 52° 72° R= 572.958/D ° T-R tan(A/2) • LC 2R sin (A/2) • E-R (sec(A/2)-1) • M-R (1-cos (A/2)) L= 10 A/D •C=2R sin(2D/2) • d=Dc/10 c' 2R sin (d/2) • Y= √√R2-X2-K • K= R2- K=R-M G H معادلات :مفيدةarrow_forwardPlease write me Background Reviews;arrow_forwardQ1/ The specific gravity of the soil is 1.41 percentage of water content by weight at field capacity and wilting point are 15% and 7% respectively calculate the equivalent moisture content as equivalent depth for 1.2m root zone : 1. at permanent wilting point 2. at field capacity 3. for ready available waterarrow_forwardarrow_back_iosSEE MORE QUESTIONSarrow_forward_ios
 Traffic and Highway EngineeringCivil EngineeringISBN:9781305156241Author:Garber, Nicholas J.Publisher:Cengage Learning