
MATLAB: An Introduction with Applications
6th Edition
ISBN: 9781119256830
Author: Amos Gilat
Publisher: John Wiley & Sons Inc
expand_more
expand_more
format_list_bulleted
Concept explainers
Videos
Textbook Question
Chapter 8, Problem 18P
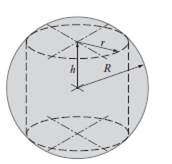
A cylinder with base radius rand height h is constructed inside a sphere such that it is in contact with the surface of a sphere, as shown in the figure. The radius of the sphere is R = 11 in.
(a) Create a polynomial expression for the volume V of the cylinder in terms of h.
(b) Make a plot of V versus h for
(c) Using the roots command determine h if the volume of the cylinder is 2000 in.3.
(d) Determine the value of h that corresponds to the cylinder with the largest possible volume, and determine that volume.
Expert Solution & Answer
Want to see the full answer?
Check out a sample textbook solution
Students have asked these similar questions
1. For this problem, state your answers to 4 significant figures.
(1)For the message signal shown below, sketch the phase-meduced
form
and 4-5/N rad V. Specify values of the miniman & maximum instantaneous frequencies in He
(b) Find the approximate bandwidth of the phase-modulaud signal, assuming that the effective handwidth of
the message is equal to its 4th harmonic frequency
(N-2015
101
2x10' 159-
4. For the filter shown below, with an input signal whose PSD by 20
(4) Find the
pet power
in
(b) Find the trafor
(4) Find the power spel de
PSD) of 4 put signat
(d) Find the talutput power of the signal
a
C-58-18
-
2.80+4'selevision stations are to be transmited deough a single fiber optic cable using uncompressed
PCM and TDM. Each station comprises one 22 kHz audio channel samplod at (1+0.24) times the Nyquist
rate and encoded at a bit dop of 12 bSa, plan one 2.0 MHz video channel sampled at the mininum rite
The video signal must be transmitted with an accuracy of better than (20
3) Find De (minimum) bit depth of the video signal.
b) Find the bit rate associated with a single television station, including both audio and video
e) Find the minimus bandwidth (the total multiplexed PCM signal.
Chapter 8 Solutions
MATLAB: An Introduction with Applications
Ch. 8 - Prob. 1PCh. 8 - Plot the polynomial y=0.7x413.5x2+6x37 in the...Ch. 8 - Determine the polynomial y(x) that has roots at x...Ch. 8 - Use MATLAB to carry out the following...Ch. 8 - Use MATLAB to carry out the following...Ch. 8 - Use MATLAB to divide the polynomial...Ch. 8 - Use MATLAB to divide the ploynomial...Ch. 8 - The product of four consecutive even integers is...Ch. 8 - The product of three integers with spacing of 3...Ch. 8 - The product of three distinct integers is 6240....
Ch. 8 - A rectangular steel container (no top) has the...Ch. 8 - An aluminum container has the geometry shown in...Ch. 8 - A rectangular box (no top) is welded together...Ch. 8 - The probability P of selecting three distinct...Ch. 8 - Write a user-defined function that adds or...Ch. 8 - Write a user-defined function that multiplies two...Ch. 8 - Write a user-defined function that calculates the...Ch. 8 - A cylinder with base radius rand height h is...Ch. 8 - Consider the parabola: x = 2(y-2)2 +3,and the...Ch. 8 - The following data is given: x -5 -4 -1 1 4 6 9 10...Ch. 8 - 21. The boiling temperature of water TB at various...Ch. 8 - The U.S. population in selected years between 1815...Ch. 8 - The number of bacteria NBmeasured at different...Ch. 8 - Growth data of a sunflower plant is given tn the...Ch. 8 - Use the growth data from Problem 24 for the...Ch. 8 - 26. The following points are given: x 1 2.2 3.7...Ch. 8 - The standard air density. D (average of...Ch. 8 - Write a user-defined function that determines the...Ch. 8 - Estimated values of thermal conductivity of...Ch. 8 - Measurements of the concentration, C, of a...Ch. 8 - Use the data from Problem 30 for the following:...Ch. 8 - The relationship between two variables y and x is...Ch. 8 - Curve-lit the data from the previous problem with...Ch. 8 - When rubber is stretched, its elongation is...Ch. 8 - The transmission of light through a transparent...
Knowledge Booster


Learn more about
Need a deep-dive on the concept behind this application? Look no further. Learn more about this topic, statistics and related others by exploring similar questions and additional content below.Similar questions
- 5. Consider a Shor who (4) Skh the impulse repom of the Chor for -5%, a-2+5. Omie weer de Sher is drain canal and explain sty odical, chronic sale of a hat will result in a coal for, and expls why itarrow_forwardFind the inverse Z-transform of X(z) using partial fraction method X(z) = z²+Z Z2-3Z+2 for i) ROC 12 iii) ROC |z| <1arrow_forward.The previous solution does not explain the steps Consider the signal: f(t) = 글씨를 1 0, otherwise Use the Fourier transform formula to find F(w).arrow_forward
- 1. Find the transfer fucntion, show all steps.arrow_forward6. Determine the type of the filter in the following figure and calculate the cut off frequency fc, show all steps.arrow_forward5. Find the Transfer Function of the following circuit. Prove that it’s a low pass filter, show all steps.arrow_forward
- 2. Find the transfer function, show all steps.arrow_forwardI have this fsk function code: function [x]=fsk_encode(b,s,f0,f1,N,Fs,K) % b= bit sequence vector % s(1)= output level for 0 % s(2)= output level for 1 % N= length of bit sequence % Fs= Sampling frequency y=zeros(1,N*K); %Setup output vector %for each bit calculatee the rando samples for n=1:N for k=1:K t = (k - 1) / Fs; if(b(n)==0) y((n-1)*K+k)=cos(2*pi*f0*t); % pulse=0 else y((n-1)*K+k)=cos(2*pi*f1*t); % pulse=1 end end x=y; %set output end And this is another code that calls the function in order to get the power density spectrum: clc;clear; % EE 382 Communication Systems- Lab 8 % Plots the power spectrum of the ASK modulation % First specify some parameters N=256; % number of bits per realization M=100; % number of realizations in the ensemble T=0.001; % bit duration in seconds delf =2e+3; fc=10e+3; f0=fc-delf; f1=fc+delf; Fs=8*f1; % sampling frequency (this is needed to calibrate the frequency axis) K=(T/(1/Fs)); % Define arrays for bit sequences and sampled waveforms…arrow_forwardCalculate the parameters in the figurearrow_forward
arrow_back_ios
SEE MORE QUESTIONS
arrow_forward_ios
Recommended textbooks for you
 Introductory Circuit Analysis (13th Edition)Electrical EngineeringISBN:9780133923605Author:Robert L. BoylestadPublisher:PEARSON
 Delmar's Standard Textbook Of ElectricityElectrical EngineeringISBN:9781337900348Author:Stephen L. HermanPublisher:Cengage Learning
 Programmable Logic ControllersElectrical EngineeringISBN:9780073373843Author:Frank D. PetruzellaPublisher:McGraw-Hill Education
 Fundamentals of Electric CircuitsElectrical EngineeringISBN:9780078028229Author:Charles K Alexander, Matthew SadikuPublisher:McGraw-Hill Education
 Electric Circuits. (11th Edition)Electrical EngineeringISBN:9780134746968Author:James W. Nilsson, Susan RiedelPublisher:PEARSON
 Engineering ElectromagneticsElectrical EngineeringISBN:9780078028151Author:Hayt, William H. (william Hart), Jr, BUCK, John A.Publisher:Mcgraw-hill Education,
Introductory Circuit Analysis (13th Edition)
Electrical Engineering
ISBN:9780133923605
Author:Robert L. Boylestad
Publisher:PEARSON
Delmar's Standard Textbook Of Electricity
Electrical Engineering
ISBN:9781337900348
Author:Stephen L. Herman
Publisher:Cengage Learning
Programmable Logic Controllers
Electrical Engineering
ISBN:9780073373843
Author:Frank D. Petruzella
Publisher:McGraw-Hill Education
Fundamentals of Electric Circuits
Electrical Engineering
ISBN:9780078028229
Author:Charles K Alexander, Matthew Sadiku
Publisher:McGraw-Hill Education
Electric Circuits. (11th Edition)
Electrical Engineering
ISBN:9780134746968
Author:James W. Nilsson, Susan Riedel
Publisher:PEARSON
Engineering Electromagnetics
Electrical Engineering
ISBN:9780078028151
Author:Hayt, William H. (william Hart), Jr, BUCK, John A.
Publisher:Mcgraw-hill Education,
Finding Local Maxima and Minima by Differentiation; Author: Professor Dave Explains;https://www.youtube.com/watch?v=pvLj1s7SOtk;License: Standard YouTube License, CC-BY