Subpart (a):
Equilibrium price .
Subpart (a):
Explanation of Solution
The equilibrium
We have given the supply equation and the demand equations and we can equate them in order to obtain the equilibrium price as follows:
Thus, the equilibrium price is $100. Now we can calculate the equilibrium quantity by substituting the equilibrium price in the equations as follows:
Thus, the equilibrium quantity is 200 units.
Concept introduction:
Equilibrium: It is the
Subpart (b):
Equilibrium price.
Subpart (b):
Explanation of Solution
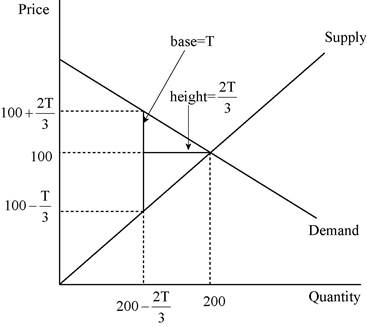
We have given the supply equation and the demand equation changes due to the tax on consumers and the new demand equation is
Thus, the price received by the producers is
Thus, the quantity is now
Concept introduction:
Equilibrium: It is the market equilibrium which is determined by equating the supply to the demand. At this equilibrium point, the supply will be equal to the demand and there will be no excess demand or excess supply in the economy. Thus, the economy will be at equilibrium.
Subpart (c):
Total tax revenue.
Subpart (c):
Explanation of Solution
We have given that the tax revenue equals to the tax rate multiplied with the quantity. The quantity is calculated in part b as
This relation between the tax revenue can be illustrated as follows:
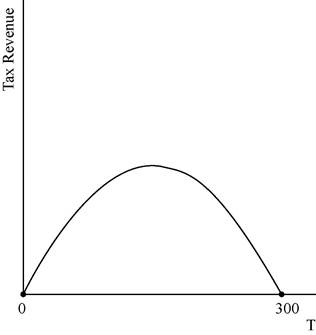
The graph depicts that the tax revenue will be zero at the tax levels of T = $0 and also at the tax rate of T = $300.
Concept introduction:
Tax: It is the unilateral payment made by the public towards the government. There are many different types of taxes in the economy which include the income tax, property tax and professional tax and so forth.
Tax revenue: Tax revenue refers to the total revenue earned by the government through imposing tax.
Subpart (d):
Deadweight loss .
Subpart (d):
Explanation of Solution
We have given that deadweight loss is the area of the triangle between the demand and supply curves. The following diagram shows, the area of the triangle (laid on its side) that represents the deadweight loss is 1/2 × base × height, where the base is the change in the price, which is the size of the tax (T) and the height is the amount of the decline in quantity (
The deadweight loss can be calculated as follows:
Thus, the deadweight loss is equal to
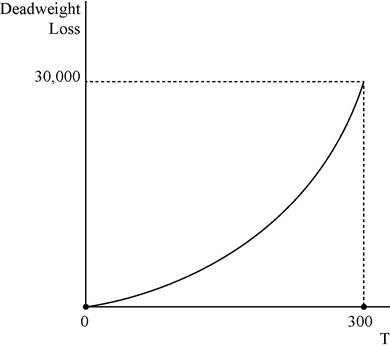
In the above diagram horizontal axis measures quantity and vertical axis measures deadweight loss.
Concept introduction:
Tax: It is the unilateral payment made by the public towards the government. There are many different types of taxes in the economy which include the income tax, property tax and professional tax and so forth.
Deadweight loss: It is the reduction in the units where the marginal benefit to the consumer is higher than the marginal cost of production of the unit.
Subpart (e):
Determine the tax amount.
Subpart (e):
Explanation of Solution
A tax of $200 will not turn out to be a good policy because the tax revenue decreases when the tax rate reaches to $300 where the tax revenue is zero. The tax revenue is at its maximum at the middle of the tax rate of $0 and $300 which is $150. Thus, in order to increase the tax revenue, the government should reduce the tax rate to $150 from $200 which will be the good alternative policy.
Concept introduction:
Tax: It is the unilateral payment made by the public towards the government. There are many different types of taxes in the economy which include the income tax, property tax and professional tax and so forth.
Want to see more full solutions like this?
Chapter 8 Solutions
Principles of Macroeconomics (MindTap Course List)

- Test Preparation QUESTION 2 [20] 2.1 Body Mass Index (BMI) is a summary measure of relative health. It is calculated by dividing an individual's weight (in kilograms) by the square of their height (in meters). A small sample was drawn from the population of UWC students to determine the effect of exercise on BMI score. Given the following table, find the constant and slope parameters of the sample regression function of BMI = f(Weekly exercise hours). Interpret the two estimated parameter values. X (Weekly exercise hours) Y (Body-Mass index) QUESTION 3 2 4 6 8 10 12 41 38 33 27 23 19 Derek investigates the relationship between the days (per year) absent from work (ABSENT) and the number of years taken for the worker to be promoted (PROMOTION). He interviewed a sample of 22 employees in Cape Town to obtain information on ABSENT (X) and PROMOTION (Y), and derived the following: ΣΧ ΣΥ 341 ΣΧΥ 176 ΣΧ 1187 1012 3.1 By using the OLS method, prove that the constant and slope parameters of the…arrow_forwardQUESTION 2 2.1 [30] Mariana, a researcher at the World Health Organisation (WHO), collects information on weekly study hours (HOURS) and blood pressure level when writing a test (BLOOD) from a sample of university students across the country, before running the regression BLOOD = f(STUDY). She collects data from 5 students as listed below: X (STUDY) 2 Y (BLOOD) 4 6 8 10 141 138 133 127 123 2.1.1 By using the OLS method and the information above derive the values for parameters B1 and B2. 2.1.2 Derive the RSS (sum of squares for the residuals). 2.1.3 Hence, calculate ô 2.2 2.3 (6) (3) Further, she replicates her study and collects data from 122 students from a rival university. She derives the residuals followed by computing skewness (S) equals -1.25 and kurtosis (K) equals 8.25 for the rival university data. Conduct the Jacque-Bera test of normality at a = 0.05. (5) Upon tasked with deriving estimates of ẞ1, B2, 82 and the standard errors (SE) of ẞ1 and B₂ for the replicated data.…arrow_forwardIf you were put in charge of ensuring that the mining industry in canada becomes more sustainable over the course of the next decade (2025-2035), how would you approach this? Come up with (at least) one resolution for each of the 4 major types of conflict: social, environmental, economic, and politicalarrow_forward
- How is the mining industry related to other Canadian labour industries? Choose one other industry, (I chose Forestry)and describe how it is related to the mining industry. How do the two industries work together? Do they ever conflict, or do they work well together?arrow_forwardWhat is the primary, secondary, tertiary, and quaternary levels of mining in Canada For each level, describe what types of careers are the most common, and describe what stage your industry’s main resource is in during that stagearrow_forwardHow does the mining industry in canada contribute to the Canadian economy? Describe why your industry is so important to the Canadian economy What would happen if your industry disappeared, or suffered significant layoffs?arrow_forward
- What is already being done to make mining in canada more sustainable? What efforts are being made in order to make mining more sustainable?arrow_forwardWhat are the environmental challenges the canadian mining industry face? Discuss current challenges that mining faces with regard to the environmentarrow_forwardWhat sustainability efforts have been put forth in the mining industry in canada Are your industry’s resources renewable or non-renewable? How do you know? Describe your industry’s reclamation processarrow_forward
- How does oligopolies practice non-price competition in South Africa?arrow_forwardWhat are the advantages and disadvantages of oligopolies on the consumers, businesses and the economy as a whole?arrow_forward1. After the reopening of borders with mainland China following the COVID-19 lockdown, residents living near the border now have the option to shop for food on either side. In Hong Kong, the cost of food is at its listed price, while across the border in mainland China, the price is only half that of Hong Kong's. A recent report indicates a decline in food sales in Hong Kong post-reopening. ** Diagrams need not be to scale; Focus on accurately representing the relevant concepts and relationships rather than the exact proportions. (a) Using a diagram, explain why Hong Kong's food sales might have dropped after the border reopening. Assume that consumers are indifferent between purchasing food in Hong Kong or mainland China, and therefore, their indifference curves have a slope of one like below. Additionally, consider that there are no transport costs and the daily food budget for consumers is identical whether they shop in Hong Kong or mainland China. I 3. 14 (b) In response to the…arrow_forward
 Microeconomics: Principles & PolicyEconomicsISBN:9781337794992Author:William J. Baumol, Alan S. Blinder, John L. SolowPublisher:Cengage Learning


