Subpart (a):
Equilibrium price .
Subpart (a):
Explanation of Solution
The equilibrium
We have given the supply equation and the demand equations and we can equate them in order to obtain the equilibrium price as follows:
Thus, the equilibrium price is $100. Now we can calculate the equilibrium quantity by substituting the equilibrium price in the equations as follows:
Thus, the equilibrium quantity is 200 units.
Concept introduction:
Equilibrium: It is the
Subpart (b):
Equilibrium price.
Subpart (b):
Explanation of Solution
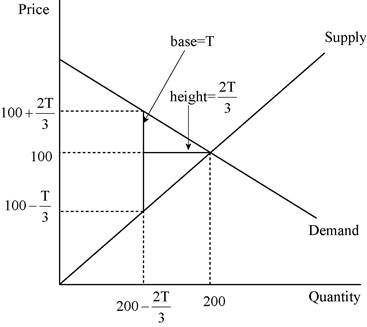
We have given the supply equation and the demand equation changes due to the tax on consumers and the new demand equation is
Thus, the price received by the producers is
Thus, the quantity is now
Concept introduction:
Equilibrium: It is the market equilibrium which is determined by equating the supply to the demand. At this equilibrium point, the supply will be equal to the demand and there will be no excess demand or excess supply in the economy. Thus, the economy will be at equilibrium.
Subpart (c):
Total tax revenue.
Subpart (c):
Explanation of Solution
We have given that the tax revenue equals to the tax rate multiplied with the quantity. The quantity is calculated in part b as
This relation between the tax revenue can be illustrated as follows:
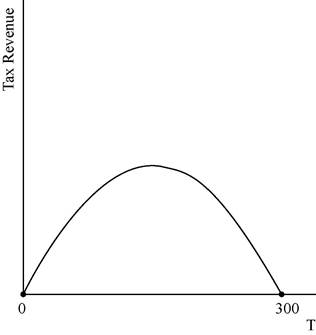
The graph depicts that the tax revenue will be zero at the tax levels of T = $0 and also at the tax rate of T = $300.
Concept introduction:
Tax: It is the unilateral payment made by the public towards the government. There are many different types of taxes in the economy which include the income tax, property tax and professional tax and so forth.
Tax revenue: Tax revenue refers to the total revenue earned by the government through imposing tax.
Subpart (d):
Deadweight loss .
Subpart (d):
Explanation of Solution
We have given that deadweight loss is the area of the triangle between the demand and supply curves. The following diagram shows, the area of the triangle (laid on its side) that represents the deadweight loss is 1/2 × base × height, where the base is the change in the price, which is the size of the tax (T) and the height is the amount of the decline in quantity (
The deadweight loss can be calculated as follows:
Thus, the deadweight loss is equal to
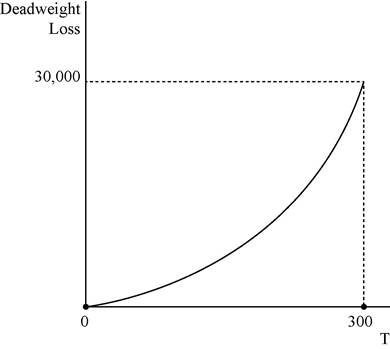
In the above diagram horizontal axis measures quantity and vertical axis measures deadweight loss.
Concept introduction:
Tax: It is the unilateral payment made by the public towards the government. There are many different types of taxes in the economy which include the income tax, property tax and professional tax and so forth.
Deadweight loss: It is the reduction in the units where the marginal benefit to the consumer is higher than the marginal cost of production of the unit.
Subpart (e):
Determine the tax amount.
Subpart (e):
Explanation of Solution
A tax of $200 will not turn out to be a good policy because the tax revenue decreases when the tax rate reaches to $300 where the tax revenue is zero. The tax revenue is at its maximum at the middle of the tax rate of $0 and $300 which is $150. Thus, in order to increase the tax revenue, the government should reduce the tax rate to $150 from $200 which will be the good alternative policy.
Concept introduction:
Tax: It is the unilateral payment made by the public towards the government. There are many different types of taxes in the economy which include the income tax, property tax and professional tax and so forth.
Want to see more full solutions like this?
Chapter 8 Solutions
Principles of Economics

- Tasks Exercise 1 Assess the following functions: 1. f(x)= x2+6x+2 2.f '(x)=10x-2x2+5 a. Find the stationary points. (5 marks) b. Determine whether the stationary point is a maximum or minimum. (5 marks) c. Draw the corresponding curves (5 marks)arrow_forwardProblem 2: The sales data over the last 10 years for the Acme Hardware Store are as follows: 2003 $230,000 2008 $526,000 2004 276,000 2009 605,000 2005 328,000 2010 690,000 2006 388,000 2011 779,000 2007 453,000 2012 873,000 1. Calculate the compound growth rate for the period of 2003 to 2012. 2. Based on your answer to part a, forecast sales for both 2013 and 2014. 3. Now calculate the compound growth rate for the period of 2007 to 2012. 1. Based on your answer to part e, forecast sales for both 2013 and 2014. 5. What is the major reason for the differences in your answers to parts b and d? If you were to make your own projections, what would you forecast? (Drawing a graph is very helpful.)arrow_forwardExercise 4A firm has the following average cost: AC = 200 + 2Q – 36 Q Find the stationary point and determine if it is a maximum or a minimum.b. Find the marginal cost function.arrow_forward
- Exercise 4A firm has the following average cost: AC = 200 + 2Q – 36 Q Find the stationary point and determine if it is a maximum or a minimum.b. Find the marginal cost function.arrow_forwardExercise 2A firm has the following short-run production function: Q = 30L2 -0.5L3a. Make a table with two columns: Production and Labour b. Add a third column to the table with the marginal product of labour c. Graph the values that you estimated for the production function and the marginal product oflabour Exercise 3A Firm has the following production function: Q= 20L-0.4L2a. Using differential calculus find the unit of labour that maximizes the production. b. Estimate function of Marginal product of labor c. Obtain the Average product of labor. d. Find the point at which the Marginal Product of Labour is equal to the Average Product of Labour.arrow_forwardProblem 3 You have the following data for the last 12 months' sales for the PRQ Corporation (in thousands of dollars): January 500 July 610 February 520 August 620 March 520 September 580 April 510 October 550 May 530 November 510 June 580 December 480 1. Calculate a 3-month centered moving average. 2. Use this moving average to forecast sales for January of next year. 3. If you were asked to forecast January and February sales for next year, would you be confident of your forecast using the preceding moving averages? Why or why not? expect? Explain.arrow_forward
- Problem 5 The MNO Corporation is preparing for its stockholder meeting on May 15, 2013. It sent out proxies to its stockholders on March 15 and asked stockholders who plan to attend the meeting to respond. To plan for a sufficient number of information packages to be distributed at the meeting, as well as for refreshments to be served, the company has asked you to forecast the number of attending stockholders. By April 15, 378 stockholders have expressed their intention to attend. You have available the following data for the last 6 years for total attendance at the stockholder meeting and the number of positive responses as of April 15: Year Positive Responses Attendance 2007 322 520 2008 301 550 2009 398 570 2010 421 600 2011 357 570 2012 452 650 1. What is your attendance forecast for the 2013 stockholder meeting? 2. Are there any other factors that could affect attendance, and thus make your forecast inac- curate?arrow_forwardProblem 4 Office Enterprises (OE) produces a line of metal office file cabinets. The company's economist, having investigated a large number of past data, has established the following equation of demand for these cabinets: Q=10,000+6013-100P+50C Q=Annual number of cabinets sold B = Index of nonresidential construction P = Average price per cabinet charged by OE C=Average price per cabinet charged by OE's closest competitor It is expected that next year's nonresidential construction index will stand at 160, OE's average price will be $40, and the competitor's average price will be $35. 1. Forecast next year's sales. 2. What will be the effect if the competitor lowers its price to 832? If it raises its price to $36? 3. What will happen if OE reacts to the decrease mentioned in part b by lowering its price to $37? 4. If the index forecast was wrong, and it turns out to be only 140 next year, what will be the effect on OE's sales? If not, what does it measure?arrow_forwardName: Problem 1: Managerial Economics, Assignment 5 April 20, 2025 If the sales of your company have grown from $500,000 five years ago to $1,050,150 this year, what is the compound growth rate? If you expect your sales to grow at a rate of 10 percent for the next five years, what should they be five years from now?arrow_forward
- 1. In this question, assume all dollar units are real dollars in billions. For example, $100 means $100 billion. Argentina thinks it can find $105 of domestic investment projects with a marginal product of capital (MPK) equal to 10% (each $1 invested in year 0 pays off $0.10 in every later year). Assume a world real interest rate r*is 5%, and initial external wealth W (W in year -1) is 0. a. You find that the formula on the lecture slide: > r*, which means that a country will ΔΟ AK take on investment projects as long as the marginal product of capital (MPK) is at least as high as the real interest rate. Using this formula, answer if Argentina should conduct the project. b. If the projects are not done, GDP = Q = C = $200 in all years. Compute the present value of Q and C. c. If Argentina conducts the projects (investing $105), what is the present value of Q and C? d. If Argentina conducts the projects, what is the present value of C? Is Argentina better off with the investment?arrow_forward2. Consider a world of two countries: Highland (H) and Lowland (L). Each country has an average output of 9 and desires to smooth consumption. All income takes the form of capital income and is fully consumed each period. Initially, there are two states of the world: Pandemic (P) and Flood (F) each occurring with 50% probability. Pandemic affects Highland and lowers the output there to 8, leaving Lowland unaffected with an output of 10. Flood affects Lowland and lowers the output there to 8, leaving Highland unaffected with an output of 10. a. Assume that households in each country own the entire capital stock of their own land. Fill in the numbers on the following table. Pandemic Highland's income Lowland's income Flood Variation about the mean b. Assume that each country owns 50% of the other country's capital. Fill in the numbers on the following table. Pandemic Flood Variation about the mean Highland's income Lowland's income c. Compare your answer to (a) and (b). Does…arrow_forward3. This question explores IS and FX equilibria in a numerical example. a. The consumption function is C = 1.5 + 0.8(Y - T). What is the marginal propensity to consume (MPC)? What is the marginal propensity to save (MPS)? b. The trade balance is TB = 5 [1-()] - (0.2(Y-8). What is the marginal propensity to consume foreign goods (MPCF)? What is the marginal propensity to consume home goods(MPCH)? c. The investment function is I = 3 - 10i. What is investment when the interest rate is equal to 0.10=10%. d. Assume government spending is G. Add up the four components of demand and write down the expression for D. Make sure that you simplify the equation. e. Derive the equation for the good market equilibrium using Y = D.arrow_forward
 Microeconomics: Principles & PolicyEconomicsISBN:9781337794992Author:William J. Baumol, Alan S. Blinder, John L. SolowPublisher:Cengage Learning


