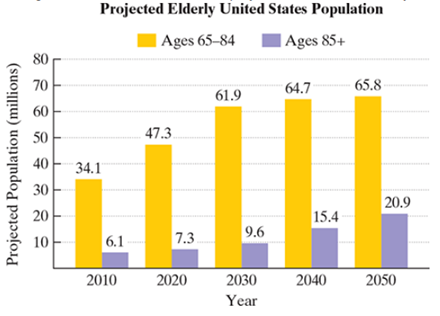
America is getting older. The graph shows the elderly U.S. population for ages 65–84 and for ages 85 and older in 2010, with projections for 2020 and beyond. The function f ( x ) = 5 x + 34.1 models the projected number of Americans ages 65–84, f ( x ) , in millions, x years after 2010. a. Use the function to find f ( 40 ) − f ( 10 ) . Express this difference in simplified radical from. What does this simplified radical represent? b. Use a calculator and write your answer in part (a) to the nearest tenth. Does this rounded decimal overestimate or underestimate the difference in the projected data shown by the bar graph? By how much?
America is getting older. The graph shows the elderly U.S. population for ages 65–84 and for ages 85 and older in 2010, with projections for 2020 and beyond. The function f ( x ) = 5 x + 34.1 models the projected number of Americans ages 65–84, f ( x ) , in millions, x years after 2010. a. Use the function to find f ( 40 ) − f ( 10 ) . Express this difference in simplified radical from. What does this simplified radical represent? b. Use a calculator and write your answer in part (a) to the nearest tenth. Does this rounded decimal overestimate or underestimate the difference in the projected data shown by the bar graph? By how much?
Solution Summary: The author explains the function of f(x) and how it represents the increase in the number of American ages.
America is getting older. The graph shows the elderly U.S. population for ages 65–84 and for ages 85 and older in 2010, with projections for 2020 and beyond.
The function
f
(
x
)
=
5
x
+
34.1
models the projected number of Americans ages 65–84,
f
(
x
)
, in millions,
x
years after 2010.
a. Use the function to find
f
(
40
)
−
f
(
10
)
. Express this difference in simplified radical from. What does this simplified radical represent?
b. Use a calculator and write your answer in part (a) to the nearest tenth. Does this rounded decimal overestimate or underestimate the difference in the projected data shown by the bar graph? By how much?
A research study in the year 2009 found that there were 2760 coyotes
in a given region. The coyote population declined at a rate of 5.8%
each year.
How many fewer coyotes were there in 2024 than in 2015?
Explain in at least one sentence how you solved the problem. Show
your work. Round your answer to the nearest whole number.
Answer the following questions related to the following matrix
A =
3
³).
Explain the following terms
Chapter 7 Solutions
Pearson eText Intermediate Algebra for College Students -- Instant Access (Pearson+)
Need a deep-dive on the concept behind this application? Look no further. Learn more about this topic, algebra and related others by exploring similar questions and additional content below.
01 - What Is A Differential Equation in Calculus? Learn to Solve Ordinary Differential Equations.; Author: Math and Science;https://www.youtube.com/watch?v=K80YEHQpx9g;License: Standard YouTube License, CC-BY
Higher Order Differential Equation with constant coefficient (GATE) (Part 1) l GATE 2018; Author: GATE Lectures by Dishank;https://www.youtube.com/watch?v=ODxP7BbqAjA;License: Standard YouTube License, CC-BY


 Glencoe Algebra 1, Student Edition, 9780079039897...AlgebraISBN:9780079039897Author:CarterPublisher:McGraw Hill
 Algebra & Trigonometry with Analytic GeometryAlgebraISBN:9781133382119Author:SwokowskiPublisher:Cengage