
Introduction To Statistics And Data Analysis
6th Edition
ISBN: 9781337794503
Author: PECK
Publisher: Cengage
expand_more
expand_more
format_list_bulleted
Concept explainers
Videos
Textbook Question
Chapter 7.4, Problem 41E
Refer to the information given in Exercise 7.39.
- a. Calculate the
mean and variance of z = total number of vehicles (cars and buses) on the ferry. - b. Calculate the mean and variance of w = total amount of money collected in tolls.
7.39 Consider a large ferry that can accommodate cars and buses. The toll for cars is $3, and the toll for buses is $10. Let x and y denote the number of cars and buses, respectively, carried on a single trip. Cars and buses are accommodated on different levels of the ferry, so the number of buses accommodated on any trip is independent of the number of cars on the trip. Suppose that x and y have the following probability distributions:
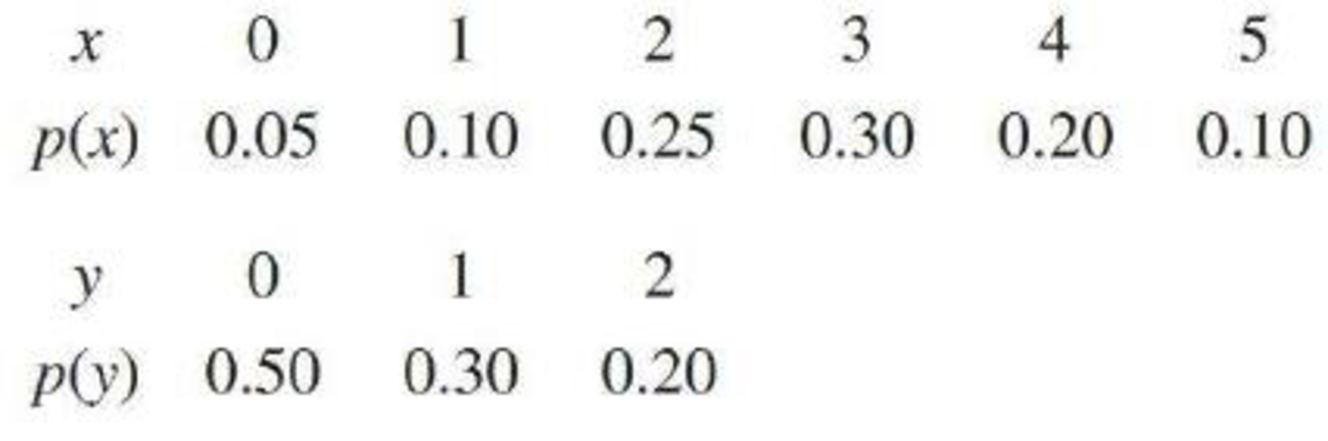
- a. Calculate the mean and standard deviation of x.
- b. Calculate the mean and standard deviation of y.
Expert Solution & Answer

Trending nowThis is a popular solution!

Students have asked these similar questions
Business
Why researchers are interested in describing measures of the center and measures of variation of a data set?
WHAT IS THE SOLUTION?
Chapter 7 Solutions
Introduction To Statistics And Data Analysis
Ch. 7.1 - State whether each of the following random...Ch. 7.1 - Classify each of the following random variables as...Ch. 7.1 - Starting at a particular time, each car entering...Ch. 7.1 - A point is randomly selected from the interior of...Ch. 7.1 - A point is randomly selected on the surface of a...Ch. 7.1 - Prob. 6ECh. 7.1 - A box contains four slips of paper marked 1, 2, 3,...Ch. 7.2 - Define the random variable x to be the number of...Ch. 7.2 - Using the probability distribution given in the...Ch. 7.2 - Let y denote the number of broken eggs in a...
Ch. 7.2 - Use the probability distribution given in the...Ch. 7.2 - Suppose that fund-raisers at a university call...Ch. 7.2 - Airlines sometimes overbook flights. Suppose that...Ch. 7.2 - Suppose that a computer manufacturer receives...Ch. 7.2 - Simulate the chance experiment described in the...Ch. 7.2 - Of all airline flight requests received by a...Ch. 7.2 - Suppose that 20% of all homeowners in an...Ch. 7.2 - A box contains five slips of paper, marked 1, 1,...Ch. 7.2 - Components coming off an assembly line are either...Ch. 7.2 - When applying for a building permit, a contractor...Ch. 7.2 - A library subscribes to two different weekly news...Ch. 7.3 - Let x denote the lifetime (in thousands of hours)...Ch. 7.3 - Using the density curve for fan lifetime given in...Ch. 7.3 - A particular professor never dismisses class...Ch. 7.3 - Refer to the probability distribution given in the...Ch. 7.3 - The article Probabilistic Risk Assessment of...Ch. 7.3 - Use the density curve of x = distance of actual...Ch. 7.3 - Let x denote the amount of gravel sold (in tons)...Ch. 7.3 - Use the density curve for x = amount of gravel...Ch. 7.3 - Let x be the amount of time (in minutes) that a...Ch. 7.3 - Ref erring to the previous exercise, let x and y...Ch. 7.3 - The density curve for the random variable w (the...Ch. 7.4 - Consider selecting a household in rural Thailand...Ch. 7.4 - Suppose the probability distribution of x, the...Ch. 7.4 - Consider the following probability distribution...Ch. 7.4 - Referring to the previous exercise, use the result...Ch. 7.4 - Exercise 7.8 gave the following probability...Ch. 7.4 - Prob. 38ECh. 7.4 - Prob. 39ECh. 7.4 - Refer to the information given in Exercise 7.39....Ch. 7.4 - Refer to the information given in Exercise 7.39....Ch. 7.4 - Suppose that for a particular computer...Ch. 7.4 - A local television station sells 15-second,...Ch. 7.4 - An author has written a book and submitted it to a...Ch. 7.4 - A grocery store has an express line for customers...Ch. 7.4 - An appliance dealer sells three different models...Ch. 7.4 - To assemble a piece of furniture, a wood peg must...Ch. 7.4 - A multiple-choice exam consists of 50 questions....Ch. 7.4 - Consider a game in which a red die and a blue die...Ch. 7.4 - Consider the random variables xR and xB defined in...Ch. 7.5 - CBS News reported that 4% of adult Americans have...Ch. 7.5 - Flight View surveyed 2600 North American airline...Ch. 7.5 - Refer to the previous exercise, and suppose that...Ch. 7.5 - Twenty-five percent of the customers of a grocery...Ch. 7.5 - Example 7.18 described a study in which a person...Ch. 7.5 - Information Security Buzz provides news for the...Ch. 7.5 - A breeder of show dogs is interested in the number...Ch. 7.5 - Womens Health Magazine surveyed 1187 readers to...Ch. 7.5 - Prob. 60ECh. 7.5 - Suppose that the probability is 0.1 that any given...Ch. 7.5 - Suppose that 30% of all automobiles undergoing an...Ch. 7.5 - Suppose that you will take a multiple-choice exam...Ch. 7.5 - Suppose that 20% of the 10,000 signatures on a...Ch. 7.5 - A city requires that smoke detectors be installed...Ch. 7.5 - Suppose that 90% of all registered California...Ch. 7.5 - Suppose a playlist on a music player consists of...Ch. 7.5 - Sophie is a dog that loves to play catch....Ch. 7.5 - Suppose that 5% of cereal boxes contain a prize...Ch. 7.6 - Determine the following standard normal (z) curve...Ch. 7.6 - Determine the following standard normal (z) curve...Ch. 7.6 - Determine each of the following areas under the...Ch. 7.6 - Determine each of the following areas under the...Ch. 7.6 - Let z denote a random variable that has a standard...Ch. 7.6 - Let z denote a random variable that has a standard...Ch. 7.6 - Let z denote a random variable having a normal...Ch. 7.6 - Let z denote a random variable having a normal...Ch. 7.6 - Let z denote a variable that has a standard normal...Ch. 7.6 - Determine the value z that a. Separates the...Ch. 7.6 - Determine the value of z such that a. z and z...Ch. 7.6 - Because P(z 0.44) = 0.67, 67% of all z values are...Ch. 7.6 - Consider the population of all 1-gallon cans of...Ch. 7.6 - Consider babies born in the normal range of 3743...Ch. 7.6 - Use the information on birth weights for babies...Ch. 7.6 - Emissions of nitrogen oxides, which are major...Ch. 7.6 - The paper referenced in Example 7.30 (Estimating...Ch. 7.6 - The size of the left upper chamber of the heart is...Ch. 7.6 - The paper referenced in the previous exercise also...Ch. 7.6 - The article New York Citys Graffiti-Removal...Ch. 7.6 - A machine that cuts corks for wine bottles...Ch. 7.6 - Refer to the previous exercise. Suppose that there...Ch. 7.6 - Purchases made at small corner stores were studied...Ch. 7.6 - The time that it takes a randomly selected job...Ch. 7.6 - Suppose that the distribution of typing speed in...Ch. 7.6 - Consider the typing speed distribution described...Ch. 7.6 - Consider the typing speed distribution described...Ch. 7.7 - The authors of the paper Development of...Ch. 7.7 - The paper Risk Behavior, Decision Making, and...Ch. 7.7 - Prob. 99ECh. 7.7 - Prob. 100ECh. 7.7 - Macular degeneration is the most common cause of...Ch. 7.7 - The following normal probability plot was...Ch. 7.7 - Consider the following 10 observations on the...Ch. 7.7 - Prob. 104ECh. 7.7 - Prob. 105ECh. 7.7 - Prob. 106ECh. 7.7 - Prob. 107ECh. 7.7 - The figure on the next page appeared in the paper...Ch. 7.8 - Let x denote the IQ of an individual selected at...Ch. 7.8 - Suppose that the distribution of x = the number of...Ch. 7.8 - The number of vehicles leaving a turnpike at a...Ch. 7.8 - Suppose that x has a binomial distribution with n...Ch. 7.8 - Prob. 113ECh. 7.8 - Prob. 114ECh. 7.8 - Prob. 115ECh. 7.8 - Suppose that 70% of the bicycles sold by a certain...Ch. 7.8 - Suppose that 25% of the fire alarms in a large...Ch. 7.8 - Suppose that 65% of all registered voters in a...Ch. 7.8 - Flashlight bulbs manufactured by a certain company...Ch. 7.8 - A company that manufactures mufflers for cars...Ch. 7 - Let x denote the duration of a randomly selected...Ch. 7 - A soft-drink machine dispenses only regular Coke...Ch. 7 - A business has six customer service telephone...Ch. 7 - Prob. 124CRCh. 7 - Refer 10 the probability distribution given in...Ch. 7 - A new batterys voltage may be acceptable (A) or...Ch. 7 - A pizza company advertises that it puts 0.5 pounds...Ch. 7 - Suppose that fuel efficiency for a particular...Ch. 7 - A coin is flipped 25 times. Let x be the number of...Ch. 7 - The probability distribution of x, the number of...Ch. 7 - The amount of time spent by a statistical...Ch. 7 - The lifetime of a certain brand of battery is...Ch. 7 - A machine producing vitamin E capsules operates so...Ch. 7 - The Wall Street Journal (February 15, 1972)...Ch. 7 - The longest run of Ss in the sequence SSFSSSSFFS...Ch. 7 - Four peoplea, b, c, and dare waiting to give...Ch. 7 - Kyle and Lygia are going to play a series of...Ch. 7 - Suppose that your statistics professor tells you...Ch. 7 - Suppose that the pH of soil samples taken from a...Ch. 7 - The lightbulbs used to provide exterior lighting...Ch. 7 - Suppose there are approximately 40,000 travel...Ch. 7 - Prob. 2CRECh. 7 - Prob. 3CRECh. 7 - Prob. 5CRECh. 7 - Prob. 6CRECh. 7 - Two shipping services offer overnight delivery of...Ch. 7 - Prob. 8CRECh. 7 - Prob. 9CRECh. 7 - The Cedar Rapids Gazette (November 20, 1999)...Ch. 7 - Prob. 11CRECh. 7 - The article Men, Women at Odds on Gun Control...Ch. 7 - Suppose that a new Internet company Mumble.com...Ch. 7 - Refer to the previous exercise. Suppose that...Ch. 7 - A chemical supply company currently has in stock...Ch. 7 - Prob. 16CRECh. 7 - An experiment was conducted to investigate whether...Ch. 7 - A machine that produces ball bearings has...Ch. 7 - Consider the variable x = time required for a...Ch. 7 - The accompanying data on x = student-teacher ratio...Ch. 7 - Prob. 21CRE
Knowledge Booster


Learn more about
Need a deep-dive on the concept behind this application? Look no further. Learn more about this topic, statistics and related others by exploring similar questions and additional content below.Similar questions
- The following ordered data list shows the data speeds for cell phones used by a telephone company at an airport: A. Calculate the Measures of Central Tendency from the ungrouped data list. B. Group the data in an appropriate frequency table. C. Calculate the Measures of Central Tendency using the table in point B. 0.8 1.4 1.8 1.9 3.2 3.6 4.5 4.5 4.6 6.2 6.5 7.7 7.9 9.9 10.2 10.3 10.9 11.1 11.1 11.6 11.8 12.0 13.1 13.5 13.7 14.1 14.2 14.7 15.0 15.1 15.5 15.8 16.0 17.5 18.2 20.2 21.1 21.5 22.2 22.4 23.1 24.5 25.7 28.5 34.6 38.5 43.0 55.6 71.3 77.8arrow_forwardII Consider the following data matrix X: X1 X2 0.5 0.4 0.2 0.5 0.5 0.5 10.3 10 10.1 10.4 10.1 10.5 What will the resulting clusters be when using the k-Means method with k = 2. In your own words, explain why this result is indeed expected, i.e. why this clustering minimises the ESS map.arrow_forwardwhy the answer is 3 and 10?arrow_forward
- PS 9 Two films are shown on screen A and screen B at a cinema each evening. The numbers of people viewing the films on 12 consecutive evenings are shown in the back-to-back stem-and-leaf diagram. Screen A (12) Screen B (12) 8 037 34 7 6 4 0 534 74 1645678 92 71689 Key: 116|4 represents 61 viewers for A and 64 viewers for B A second stem-and-leaf diagram (with rows of the same width as the previous diagram) is drawn showing the total number of people viewing films at the cinema on each of these 12 evenings. Find the least and greatest possible number of rows that this second diagram could have. TIP On the evening when 30 people viewed films on screen A, there could have been as few as 37 or as many as 79 people viewing films on screen B.arrow_forwardQ.2.4 There are twelve (12) teams participating in a pub quiz. What is the probability of correctly predicting the top three teams at the end of the competition, in the correct order? Give your final answer as a fraction in its simplest form.arrow_forwardThe table below indicates the number of years of experience of a sample of employees who work on a particular production line and the corresponding number of units of a good that each employee produced last month. Years of Experience (x) Number of Goods (y) 11 63 5 57 1 48 4 54 5 45 3 51 Q.1.1 By completing the table below and then applying the relevant formulae, determine the line of best fit for this bivariate data set. Do NOT change the units for the variables. X y X2 xy Ex= Ey= EX2 EXY= Q.1.2 Estimate the number of units of the good that would have been produced last month by an employee with 8 years of experience. Q.1.3 Using your calculator, determine the coefficient of correlation for the data set. Interpret your answer. Q.1.4 Compute the coefficient of determination for the data set. Interpret your answer.arrow_forward
- Can you answer this question for mearrow_forwardTechniques QUAT6221 2025 PT B... TM Tabudi Maphoru Activities Assessments Class Progress lIE Library • Help v The table below shows the prices (R) and quantities (kg) of rice, meat and potatoes items bought during 2013 and 2014: 2013 2014 P1Qo PoQo Q1Po P1Q1 Price Ро Quantity Qo Price P1 Quantity Q1 Rice 7 80 6 70 480 560 490 420 Meat 30 50 35 60 1 750 1 500 1 800 2 100 Potatoes 3 100 3 100 300 300 300 300 TOTAL 40 230 44 230 2 530 2 360 2 590 2 820 Instructions: 1 Corall dawn to tha bottom of thir ceraan urina se se tha haca nariad in archerca antarand cubmit Q Search ENG US 口X 2025/05arrow_forwardThe table below indicates the number of years of experience of a sample of employees who work on a particular production line and the corresponding number of units of a good that each employee produced last month. Years of Experience (x) Number of Goods (y) 11 63 5 57 1 48 4 54 45 3 51 Q.1.1 By completing the table below and then applying the relevant formulae, determine the line of best fit for this bivariate data set. Do NOT change the units for the variables. X y X2 xy Ex= Ey= EX2 EXY= Q.1.2 Estimate the number of units of the good that would have been produced last month by an employee with 8 years of experience. Q.1.3 Using your calculator, determine the coefficient of correlation for the data set. Interpret your answer. Q.1.4 Compute the coefficient of determination for the data set. Interpret your answer.arrow_forward
- Q.3.2 A sample of consumers was asked to name their favourite fruit. The results regarding the popularity of the different fruits are given in the following table. Type of Fruit Number of Consumers Banana 25 Apple 20 Orange 5 TOTAL 50 Draw a bar chart to graphically illustrate the results given in the table.arrow_forwardQ.2.3 The probability that a randomly selected employee of Company Z is female is 0.75. The probability that an employee of the same company works in the Production department, given that the employee is female, is 0.25. What is the probability that a randomly selected employee of the company will be female and will work in the Production department? Q.2.4 There are twelve (12) teams participating in a pub quiz. What is the probability of correctly predicting the top three teams at the end of the competition, in the correct order? Give your final answer as a fraction in its simplest form.arrow_forwardQ.2.1 A bag contains 13 red and 9 green marbles. You are asked to select two (2) marbles from the bag. The first marble selected will not be placed back into the bag. Q.2.1.1 Construct a probability tree to indicate the various possible outcomes and their probabilities (as fractions). Q.2.1.2 What is the probability that the two selected marbles will be the same colour? Q.2.2 The following contingency table gives the results of a sample survey of South African male and female respondents with regard to their preferred brand of sports watch: PREFERRED BRAND OF SPORTS WATCH Samsung Apple Garmin TOTAL No. of Females 30 100 40 170 No. of Males 75 125 80 280 TOTAL 105 225 120 450 Q.2.2.1 What is the probability of randomly selecting a respondent from the sample who prefers Garmin? Q.2.2.2 What is the probability of randomly selecting a respondent from the sample who is not female? Q.2.2.3 What is the probability of randomly…arrow_forward
arrow_back_ios
SEE MORE QUESTIONS
arrow_forward_ios
Recommended textbooks for you
 Functions and Change: A Modeling Approach to Coll...AlgebraISBN:9781337111348Author:Bruce Crauder, Benny Evans, Alan NoellPublisher:Cengage Learning
 Holt Mcdougal Larson Pre-algebra: Student Edition...AlgebraISBN:9780547587776Author:HOLT MCDOUGALPublisher:HOLT MCDOUGAL
 Glencoe Algebra 1, Student Edition, 9780079039897...AlgebraISBN:9780079039897Author:CarterPublisher:McGraw Hill
 Big Ideas Math A Bridge To Success Algebra 1: Stu...AlgebraISBN:9781680331141Author:HOUGHTON MIFFLIN HARCOURTPublisher:Houghton Mifflin Harcourt
 Algebra: Structure And Method, Book 1AlgebraISBN:9780395977224Author:Richard G. Brown, Mary P. Dolciani, Robert H. Sorgenfrey, William L. ColePublisher:McDougal Littell
 College Algebra (MindTap Course List)AlgebraISBN:9781305652231Author:R. David Gustafson, Jeff HughesPublisher:Cengage Learning
Functions and Change: A Modeling Approach to Coll...
Algebra
ISBN:9781337111348
Author:Bruce Crauder, Benny Evans, Alan Noell
Publisher:Cengage Learning
Holt Mcdougal Larson Pre-algebra: Student Edition...
Algebra
ISBN:9780547587776
Author:HOLT MCDOUGAL
Publisher:HOLT MCDOUGAL
Glencoe Algebra 1, Student Edition, 9780079039897...
Algebra
ISBN:9780079039897
Author:Carter
Publisher:McGraw Hill
Big Ideas Math A Bridge To Success Algebra 1: Stu...
Algebra
ISBN:9781680331141
Author:HOUGHTON MIFFLIN HARCOURT
Publisher:Houghton Mifflin Harcourt
Algebra: Structure And Method, Book 1
Algebra
ISBN:9780395977224
Author:Richard G. Brown, Mary P. Dolciani, Robert H. Sorgenfrey, William L. Cole
Publisher:McDougal Littell
College Algebra (MindTap Course List)
Algebra
ISBN:9781305652231
Author:R. David Gustafson, Jeff Hughes
Publisher:Cengage Learning
Correlation Vs Regression: Difference Between them with definition & Comparison Chart; Author: Key Differences;https://www.youtube.com/watch?v=Ou2QGSJVd0U;License: Standard YouTube License, CC-BY
Correlation and Regression: Concepts with Illustrative examples; Author: LEARN & APPLY : Lean and Six Sigma;https://www.youtube.com/watch?v=xTpHD5WLuoA;License: Standard YouTube License, CC-BY