
Statistics Through Applications
2nd Edition
ISBN: 9781429219747
Author: Daren S. Starnes, David Moore, Dan Yates
Publisher: Macmillan Higher Education
expand_more
expand_more
format_list_bulleted
Concept explainers
Videos
Question
Chapter 7.3, Problem 7.59E
(a)
To determine
To construct: a tree diagram to represent this chance process.
(a)
Expert Solution
Explanation of Solution
Graph:
A coin tossed 4 times, H represent head and T represent tail in this diagram
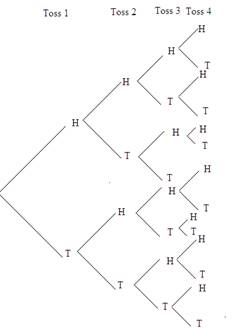
A coin is tossed 4 time times in each time it gives two
(b)
To determine
To Calculate: the probability that get at least one head.
(b)
Expert Solution
Answer to Problem 7.59E
0.9375
Explanation of Solution
Formula used:
Calculation:
Chapter 7 Solutions
Statistics Through Applications
Ch. 7.1 - Prob. 7.1ECh. 7.1 - Prob. 7.2ECh. 7.1 - Prob. 7.3ECh. 7.1 - Prob. 7.4ECh. 7.1 - Prob. 7.5ECh. 7.1 - Prob. 7.6ECh. 7.1 - Prob. 7.7ECh. 7.1 - Prob. 7.8ECh. 7.1 - Prob. 7.9ECh. 7.1 - Prob. 7.10E
Ch. 7.1 - Prob. 7.11ECh. 7.1 - Prob. 7.12ECh. 7.1 - Prob. 7.13ECh. 7.1 - Prob. 7.14ECh. 7.1 - Prob. 7.15ECh. 7.1 - Prob. 7.16ECh. 7.1 - Prob. 7.17ECh. 7.1 - Prob. 7.18ECh. 7.1 - Prob. 7.19ECh. 7.1 - Prob. 7.20ECh. 7.1 - Prob. 7.21ECh. 7.1 - Prob. 7.22ECh. 7.1 - Prob. 7.23ECh. 7.1 - Prob. 7.24ECh. 7.1 - Prob. 7.25ECh. 7.1 - Prob. 7.26ECh. 7.2 - Prob. 7.27ECh. 7.2 - Prob. 7.28ECh. 7.2 - Prob. 7.29ECh. 7.2 - Prob. 7.30ECh. 7.2 - Prob. 7.31ECh. 7.2 - Prob. 7.32ECh. 7.2 - Prob. 7.33ECh. 7.2 - Prob. 7.34ECh. 7.2 - Prob. 7.35ECh. 7.2 - Prob. 7.36ECh. 7.2 - Prob. 7.37ECh. 7.2 - Prob. 7.38ECh. 7.2 - Prob. 7.39ECh. 7.2 - Prob. 7.40ECh. 7.2 - Prob. 7.41ECh. 7.2 - Prob. 7.42ECh. 7.2 - Prob. 7.43ECh. 7.2 - Prob. 7.44ECh. 7.2 - Prob. 7.45ECh. 7.2 - Prob. 7.46ECh. 7.2 - Prob. 7.47ECh. 7.2 - Prob. 7.48ECh. 7.2 - Prob. 7.49ECh. 7.2 - Prob. 7.50ECh. 7.2 - Prob. 7.51ECh. 7.2 - Prob. 7.52ECh. 7.3 - Prob. 7.53ECh. 7.3 - Prob. 7.54ECh. 7.3 - Prob. 7.55ECh. 7.3 - Prob. 7.56ECh. 7.3 - Prob. 7.57ECh. 7.3 - Prob. 7.58ECh. 7.3 - Prob. 7.59ECh. 7.3 - Prob. 7.60ECh. 7.3 - Prob. 7.61ECh. 7.3 - Prob. 7.62ECh. 7.3 - Prob. 7.63ECh. 7.3 - Prob. 7.64ECh. 7.3 - Prob. 7.65ECh. 7.3 - Prob. 7.66ECh. 7.3 - Prob. 7.67ECh. 7.3 - Prob. 7.68ECh. 7.3 - Prob. 7.69ECh. 7.3 - Prob. 7.70ECh. 7.3 - Prob. 7.71ECh. 7.3 - Prob. 7.72ECh. 7.3 - Prob. 7.73ECh. 7.3 - Prob. 7.74ECh. 7.3 - Prob. 7.75ECh. 7.3 - Prob. 7.76ECh. 7.3 - Prob. 7.77ECh. 7.3 - Prob. 7.78ECh. 7 - Prob. 7.79RECh. 7 - Prob. 7.80RECh. 7 - Prob. 7.81RECh. 7 - Prob. 7.82RECh. 7 - Prob. 7.83RECh. 7 - Prob. 7.84RECh. 7 - Prob. 7.85RECh. 7 - Prob. 7.86RECh. 7 - Prob. 7.87RECh. 7 - Prob. 7.88RE
Additional Math Textbook Solutions
Find more solutions based on key concepts
1. combination of numbers, variables, and operation symbols is called an algebraic______.
Algebra and Trigonometry (6th Edition)
A categorical variable has three categories, with the following frequencies of occurrence: a. Compute the perce...
Basic Business Statistics, Student Value Edition
Disk method Let R be the region bounded by the following curves. Use the disk method to find the volume of the ...
Calculus: Early Transcendentals (2nd Edition)
CHECK POINT I You deposit $3000 in s savings account at Yourtown Bank, which has rate of 5%. Find the interest ...
Thinking Mathematically (6th Edition)
Fill in each blanks so that the resulting statement is true. Any set of ordered pairs is called a/an _______. T...
College Algebra (7th Edition)
Knowledge Booster


Learn more about
Need a deep-dive on the concept behind this application? Look no further. Learn more about this topic, statistics and related others by exploring similar questions and additional content below.Similar questions
- NC Current Students - North Ce X | NC Canvas Login Links - North ( X Final Exam Comprehensive x Cengage Learning x WASTAT - Final Exam - STAT → C webassign.net/web/Student/Assignment-Responses/submit?dep=36055360&tags=autosave#question3659890_9 Part (b) Draw a scatter plot of the ordered pairs. N Life Expectancy Life Expectancy 80 70 600 50 40 30 20 10 Year of 1950 1970 1990 2010 Birth O Life Expectancy Part (c) 800 70 60 50 40 30 20 10 1950 1970 1990 W ALT 林 $ # 4 R J7 Year of 2010 Birth F6 4+ 80 70 60 50 40 30 20 10 Year of 1950 1970 1990 2010 Birth Life Expectancy Ox 800 70 60 50 40 30 20 10 Year of 1950 1970 1990 2010 Birth hp P.B. KA & 7 80 % 5 H A B F10 711 N M K 744 PRT SC ALT CTRLarrow_forwardHarvard University California Institute of Technology Massachusetts Institute of Technology Stanford University Princeton University University of Cambridge University of Oxford University of California, Berkeley Imperial College London Yale University University of California, Los Angeles University of Chicago Johns Hopkins University Cornell University ETH Zurich University of Michigan University of Toronto Columbia University University of Pennsylvania Carnegie Mellon University University of Hong Kong University College London University of Washington Duke University Northwestern University University of Tokyo Georgia Institute of Technology Pohang University of Science and Technology University of California, Santa Barbara University of British Columbia University of North Carolina at Chapel Hill University of California, San Diego University of Illinois at Urbana-Champaign National University of Singapore McGill…arrow_forwardName Harvard University California Institute of Technology Massachusetts Institute of Technology Stanford University Princeton University University of Cambridge University of Oxford University of California, Berkeley Imperial College London Yale University University of California, Los Angeles University of Chicago Johns Hopkins University Cornell University ETH Zurich University of Michigan University of Toronto Columbia University University of Pennsylvania Carnegie Mellon University University of Hong Kong University College London University of Washington Duke University Northwestern University University of Tokyo Georgia Institute of Technology Pohang University of Science and Technology University of California, Santa Barbara University of British Columbia University of North Carolina at Chapel Hill University of California, San Diego University of Illinois at Urbana-Champaign National University of Singapore…arrow_forward
- A company found that the daily sales revenue of its flagship product follows a normal distribution with a mean of $4500 and a standard deviation of $450. The company defines a "high-sales day" that is, any day with sales exceeding $4800. please provide a step by step on how to get the answers in excel Q: What percentage of days can the company expect to have "high-sales days" or sales greater than $4800? Q: What is the sales revenue threshold for the bottom 10% of days? (please note that 10% refers to the probability/area under bell curve towards the lower tail of bell curve) Provide answers in the yellow cellsarrow_forwardFind the critical value for a left-tailed test using the F distribution with a 0.025, degrees of freedom in the numerator=12, and degrees of freedom in the denominator = 50. A portion of the table of critical values of the F-distribution is provided. Click the icon to view the partial table of critical values of the F-distribution. What is the critical value? (Round to two decimal places as needed.)arrow_forwardA retail store manager claims that the average daily sales of the store are $1,500. You aim to test whether the actual average daily sales differ significantly from this claimed value. You can provide your answer by inserting a text box and the answer must include: Null hypothesis, Alternative hypothesis, Show answer (output table/summary table), and Conclusion based on the P value. Showing the calculation is a must. If calculation is missing,so please provide a step by step on the answers Numerical answers in the yellow cellsarrow_forward
arrow_back_ios
SEE MORE QUESTIONS
arrow_forward_ios
Recommended textbooks for you
 MATLAB: An Introduction with ApplicationsStatisticsISBN:9781119256830Author:Amos GilatPublisher:John Wiley & Sons Inc
 Probability and Statistics for Engineering and th...StatisticsISBN:9781305251809Author:Jay L. DevorePublisher:Cengage Learning
 Statistics for The Behavioral Sciences (MindTap C...StatisticsISBN:9781305504912Author:Frederick J Gravetter, Larry B. WallnauPublisher:Cengage Learning
 Elementary Statistics: Picturing the World (7th E...StatisticsISBN:9780134683416Author:Ron Larson, Betsy FarberPublisher:PEARSON
 The Basic Practice of StatisticsStatisticsISBN:9781319042578Author:David S. Moore, William I. Notz, Michael A. FlignerPublisher:W. H. Freeman
 Introduction to the Practice of StatisticsStatisticsISBN:9781319013387Author:David S. Moore, George P. McCabe, Bruce A. CraigPublisher:W. H. Freeman
MATLAB: An Introduction with Applications
Statistics
ISBN:9781119256830
Author:Amos Gilat
Publisher:John Wiley & Sons Inc
Probability and Statistics for Engineering and th...
Statistics
ISBN:9781305251809
Author:Jay L. Devore
Publisher:Cengage Learning
Statistics for The Behavioral Sciences (MindTap C...
Statistics
ISBN:9781305504912
Author:Frederick J Gravetter, Larry B. Wallnau
Publisher:Cengage Learning
Elementary Statistics: Picturing the World (7th E...
Statistics
ISBN:9780134683416
Author:Ron Larson, Betsy Farber
Publisher:PEARSON
The Basic Practice of Statistics
Statistics
ISBN:9781319042578
Author:David S. Moore, William I. Notz, Michael A. Fligner
Publisher:W. H. Freeman
Introduction to the Practice of Statistics
Statistics
ISBN:9781319013387
Author:David S. Moore, George P. McCabe, Bruce A. Craig
Publisher:W. H. Freeman
Mod-01 Lec-01 Discrete probability distributions (Part 1); Author: nptelhrd;https://www.youtube.com/watch?v=6x1pL9Yov1k;License: Standard YouTube License, CC-BY
Discrete Probability Distributions; Author: Learn Something;https://www.youtube.com/watch?v=m9U4UelWLFs;License: Standard YouTube License, CC-BY
Probability Distribution Functions (PMF, PDF, CDF); Author: zedstatistics;https://www.youtube.com/watch?v=YXLVjCKVP7U;License: Standard YouTube License, CC-BY
Discrete Distributions: Binomial, Poisson and Hypergeometric | Statistics for Data Science; Author: Dr. Bharatendra Rai;https://www.youtube.com/watch?v=lHhyy4JMigg;License: Standard Youtube License