
Concept explainers
Videos
Harsh, mandatory minimum sentence for drug offensesaccount for more than half the population in U.S. federalprisons. The bar graph shows the number of inmates infederal prisons, in thousands, (or drug offenses and all othercrimes in 1998 and 2010. (Other crimes include murder, robbery, fraud, burglary, weapons offenses, immigration offenses, racketeering, and perjury.)
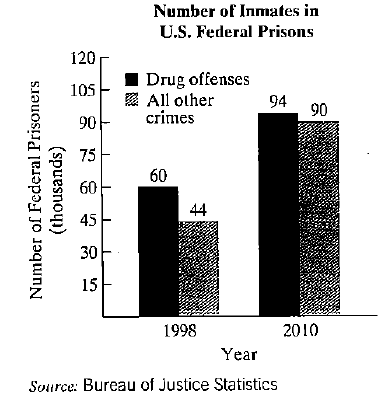
a. In 1998, there were 60 thousand inmates in federalprisons Tor drug offenses, hoi the period shown by the graph, this number increased by approximately2.8 thousand inmates per year. Write a function thatmodels the number of inmates, y. in thousands, tor drug offenses x years after 1998.
b. In 1998, there were 44 thousand inmates in federalprisons for all crimes other than drug offenses. For theperiod shown by the graph, this number increased byapproximately 3.8 thousand inmates per year. Writea function that models the number of inmates, y. inthousands, for all crimes other than drug offenses x yearsafter 1998.
c. Use the models from parts (a) and (b) to determinem which year the number of federal inmates for drug offenses was the same as the number of federal inmatesfor all other crimes. How many inmates were there fordrug offenses and for all other crimes in that year?2014:104.8thousand
Want to see the full answer?
Check out a sample textbook solution
Chapter 7 Solutions
Thinking Mathematically (7th Edition)


- Let D be a directed graph, with loops allowed, for which the indegree at each vertex is at most k and the outdegree at each vertex is at most k. Prove that the arcs of D can be colored so that the arcs entering each vertex must have distinct colors and the arcs leaving each vertex have distinct colors. An arc entering a vertex may have the same color as an arc leaving it. It is probably easiest to make use of a known result about edge coloring. Think about splitting each vertex into an ‘in’ and ‘out’ part and consider what type of graph you get.arrow_forward3:56 wust.instructure.com Page 0 Chapter 5 Test Form A of 2 - ZOOM + | Find any real numbers for which each expression is undefined. 2x 4 1. x Name: Date: 1. 3.x-5 2. 2. x²+x-12 4x-24 3. Evaluate when x=-3. 3. x Simplify each rational expression. x²-3x 4. 2x-6 5. x²+3x-18 x²-9 6. Write an equivalent rational expression with the given denominator. 2x-3 x²+2x+1(x+1)(x+2) Perform the indicated operation and simplify if possible. x²-16 x-3 7. 3x-9 x²+2x-8 x²+9x+20 5x+25 8. 4.x 2x² 9. x-5 x-5 3 5 10. 4x-3 8x-6 2 3 11. x-4 x+4 x 12. x-2x-8 x²-4 ← -> Copyright ©2020 Pearson Education, Inc. + 5 4. 5. 6. 7. 8. 9. 10. 11. 12. T-97arrow_forwardplease work out more details give the solution.arrow_forward
- Problem #5 Suppose you flip a two sided fair coin ("heads" or "tails") 8 total times. a). How many ways result in 6 tails and 2 heads? b). How many ways result in 2 tails and 6 heads? c). Compare your answers to part (a) and (b) and explain in a few sentences why the comparison makes sense.arrow_forwardBurger Dome sells hamburgers, cheeseburgers, french fries, soft drinks, and milk shakes, as well as a limited number of specialty items and dessert selections. Although Burger Dome would like to serve each customer immediately, at times more customers arrive than can be handled by the Burger Dome food service staff. Thus, customers wait in line to place and receive their orders. Burger Dome analyzed data on customer arrivals and concluded that the arrival rate is 30 customers per hour. Burger Dome also studied the order-filling process and found that a single employee can process an average of 44 customer orders per hour. Burger Dome is concerned that the methods currently used to serve customers are resulting in excessive waiting times and a possible loss of sales. Management wants to conduct a waiting line study to help determine the best approach to reduce waiting times and improve service. Suppose Burger Dome establishes two servers but arranges the restaurant layout so that an…arrow_forwardPEER REPLY 1: Choose a classmate's Main Post. 1. Indicate a range of values for the independent variable (x) that is reasonable based on the data provided. 2. Explain what the predicted range of dependent values should be based on the range of independent values.arrow_forward
- Note: A waiting line model solver computer package is needed to answer these questions. The Kolkmeyer Manufacturing Company uses a group of six identical machines, each of which operates an average of 18 hours between breakdowns. With randomly occurring breakdowns, the Poisson probability distribution is used to describe the machine breakdown arrival process. One person from the maintenance department provides the single-server repair service for the six machines. Management is now considering adding two machines to its manufacturing operation. This addition will bring the number of machines to eight. The president of Kolkmeyer asked for a study of the need to add a second employee to the repair operation. The service rate for each individual assigned to the repair operation is 0.50 machines per hour. (a) Compute the operating characteristics if the company retains the single-employee repair operation. (Round your answers to four decimal places. Report time in hours.) La = L = Wa = W =…arrow_forward10 20 30 y vernier protractor scales. 60 30 0 30 60 40 30 20 10 0 30 60 0 10. Write the complement of each of the following angles. a. 67° b. 17°41' 11. Write the supplement of each of the following angles. a.41° b.99°32' 30 60 C. 20 10 20 90 60 30 69 30 30 40 50 c. 54°47' 53" 0 30 60 c. 103°03'27" 12. Given: AB CD and EF GH. Determine the value of each angle, 21 through /10, to the nearer minute. A- 25 21 = 22 = 23 = 24 = 25 = 46= 27 = C 28 = 29 = 210 = E 26 22 210 81°00' 29 4 142°00' G H 94°40' B Darrow_forward5. For the function y-x³-3x²-1, use derivatives to: (a) determine the intervals of increase and decrease. (b) determine the local (relative) maxima and minima. (e) determine the intervals of concavity. (d) determine the points of inflection. (e) sketch the graph with the above information indicated on the graph.arrow_forward
- A local company has a 6 person management team and 20 employees. The company needs to select 3 people from the management team and 7 employees to attend a regional meeting. How many different possibilities are there for the group that can be sent to the regional meeting?arrow_forwardCan you solve this 2 question numerical methodarrow_forwardI have 15 outfits to select from to pack for my business trip. I would like to select three of them to pack in my suitcase. How many packing possibilities are there?arrow_forward
 Glencoe Algebra 1, Student Edition, 9780079039897...AlgebraISBN:9780079039897Author:CarterPublisher:McGraw Hill
 Holt Mcdougal Larson Pre-algebra: Student Edition...AlgebraISBN:9780547587776Author:HOLT MCDOUGALPublisher:HOLT MCDOUGAL
 Functions and Change: A Modeling Approach to Coll...AlgebraISBN:9781337111348Author:Bruce Crauder, Benny Evans, Alan NoellPublisher:Cengage Learning