Concept explainers
An important application of systems of equations arises in connection with supply and demand. As the price of a product increases, the demand for that product decreases. However, at higher prices, suppliers are willing to produce greater quantities of the product. The price at which supply and demand are equal is called the equilibrium price. The quantity supplied and demanded at that price is called the equilibrium quantity. Exercises 61-62 involve supply and demand.
The following models describe wages for low-skilled labor.
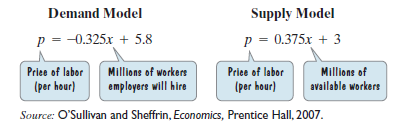
a. Solve the system and find the equilibrium number of workers, in millions, and the equilibrium hourly wage.
b. Use your answer from part (a) to complete this statement:
If workers are paid ____ per hour, there will be ____ million available workers and ____ million workers will be hired.
c. In 2007, the federal minimum wage was set at $5.15 per hour. Substitute 5.15 for p in the demand model,
d. At a minimum wage of $5.15 per hour, use the supply model,
e. At a minimum wage of $5.15 per hour, use your answers from parts (c) and (d) to determine how many more people are looking for work than employers are willing to hire.
Want to see the full answer?
Check out a sample textbook solution
Chapter 7 Solutions
Thinking Mathematically (6th Edition)
- 2. In each case below, state whether the statement is true or false. Justify your answer in each case. (i) Suppose A and B are sets. Then, AnB = 6 ⇒ AUB = A (ii) Suppose A and B are sets. Then, AUB = B ⇒ ACB (iii) Suppose A and B are sets. Then, AUB = B ⇒ B C Aarrow_forward5arrow_forwardNo chatgpt pls will upvotearrow_forward
- 1. Find the mean of the x-values (x-bar) and the mean of the y-values (y-bar) and write/label each here: 2. Label the second row in the table using proper notation; then, complete the table. In the fifth and sixth columns, show the 'products' of what you're multiplying, as well as the answers. X y x minus x-bar y minus y-bar (x minus x-bar)(y minus y-bar) (x minus x-bar)^2 xy 16 20 34 4-2 5 2 3. Write the sums that represents Sxx and Sxy in the table, at the bottom of their respective columns. 4. Find the slope of the Regression line: bi = (simplify your answer) 5. Find the y-intercept of the Regression line, and then write the equation of the Regression line. Show your work. Then, BOX your final answer. Express your line as "y-hat equals...arrow_forwardApply STATA commands & submit the output for each question only when indicated below i. Generate the log of birthweight and family income of children. Name these new variables Ibwght & Ifaminc. Include the output of this code. ii. Apply the command sum with the detail option to the variable faminc. Note: you should find the 25th percentile value, the 50th percentile and the 75th percentile value of faminc from the output - you will need it to answer the next question Include the output of this code. iii. iv. Use the output from part ii of this question to Generate a variable called "high_faminc" that takes a value 1 if faminc is less than or equal to the 25th percentile, it takes the value 2 if faminc is greater than 25th percentile but less than or equal to the 50th percentile, it takes the value 3 if faminc is greater than 50th percentile but less than or equal to the 75th percentile, it takes the value 4 if faminc is greater than the 75th percentile. Include the outcome of this code…arrow_forwardsolve this on paperarrow_forward
- For each given function f(x) find f'(x) using the rules learned in section 9.5. 1. f(x)=x32 32x 2. f(x)=7x+13 3. f(x) = x4 4. f(x) = √√x³ 5. f(x) = 3x²+ 3 x2arrow_forwardApply STATA commands & submit the output for each question only when indicated below i. Apply the command egen to create a variable called "wyd" which is the rowtotal function on variables bwght & faminc. ii. Apply the list command for the first 10 observations to show that the code in part i worked. Include the outcome of this code iii. Apply the egen command to create a new variable called "bwghtsum" using the sum function on variable bwght by the variable high_faminc (Note: need to apply the bysort' statement) iv. Apply the "by high_faminc" statement to find the V. descriptive statistics of bwght and bwghtsum Include the output of this code. Why is there a difference between the standard deviations of bwght and bwghtsum from part iv of this question?arrow_forwardAccording to a health information website, the distribution of adults’ diastolic blood pressure (in millimeters of mercury, mmHg) can be modeled by a normal distribution with mean 70 mmHg and standard deviation 20 mmHg. b. Above what diastolic pressure would classify someone in the highest 1% of blood pressures? Show all calculations used.arrow_forward
- Write STATA codes which will generate the outcomes in the questions & submit the output for each question only when indicated below i. ii. iii. iv. V. Write a code which will allow STATA to go to your favorite folder to access your files. Load the birthweight1.dta dataset from your favorite folder and save it under a different filename to protect data integrity. Call the new dataset babywt.dta (make sure to use the replace option). Verify that it contains 2,998 observations and 8 variables. Include the output of this code. Are there missing observations for variable(s) for the variables called bwght, faminc, cigs? How would you know? (You may use more than one code to show your answer(s)) Include the output of your code (s). Write the definitions of these variables: bwght, faminc, male, white, motheduc,cigs; which of these variables are categorical? [Hint: use the labels of the variables & the browse command] Who is this dataset about? Who can use this dataset to answer what kind of…arrow_forwardApply STATA commands & submit the output for each question only when indicated below İ. ii. iii. iv. V. Apply the command summarize on variables bwght and faminc. What is the average birthweight of babies and family income of the respondents? Include the output of this code. Apply the tab command on the variable called male. How many of the babies and what share of babies are male? Include the output of this code. Find the summary statistics (i.e. use the sum command) of the variables bwght and faminc if the babies are white. Include the output of this code. Find the summary statistics (i.e. use the sum command) of the variables bwght and faminc if the babies are male but not white. Include the output of this code. Using your answers to previous subparts of this question: What is the difference between the average birthweight of a baby who is male and a baby who is male but not white? What can you say anything about the difference in family income of the babies that are male and male…arrow_forwardnot use ai pleasearrow_forward
- Linear Algebra: A Modern IntroductionAlgebraISBN:9781285463247Author:David PoolePublisher:Cengage LearningAlgebra & Trigonometry with Analytic GeometryAlgebraISBN:9781133382119Author:SwokowskiPublisher:Cengage
