
ELEMTARY STATISTICS W/STATLAB(LL)
13th Edition
ISBN: 9781323774731
Author: Triola
Publisher: PEARSON
expand_more
expand_more
format_list_bulleted
Videos
Textbook Question
Chapter 7.3, Problem 3BSC
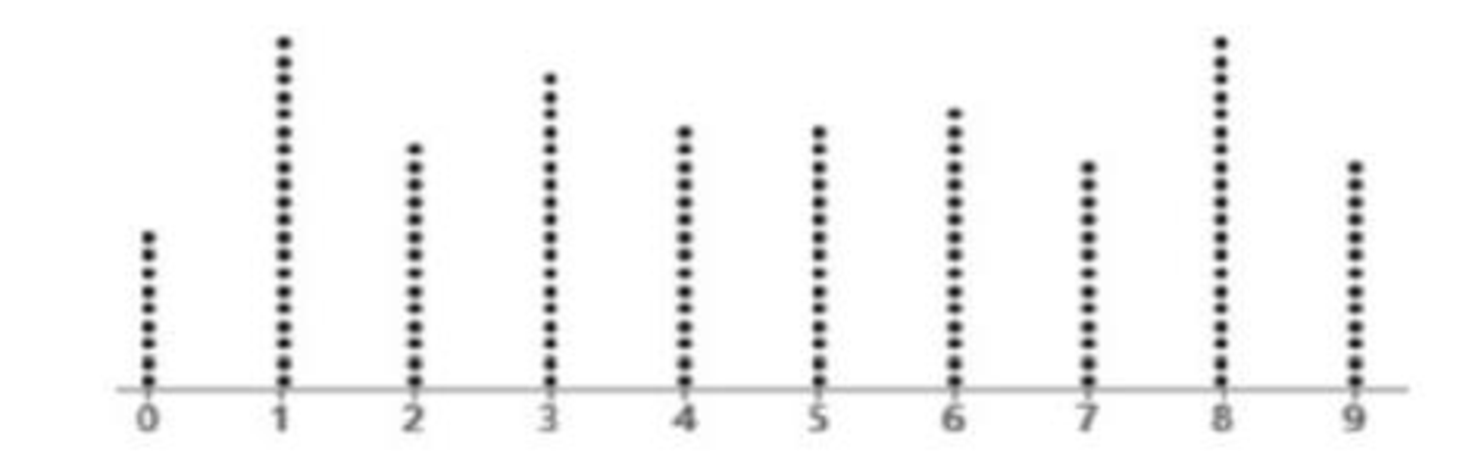
Last Digit Analysis The dotplot below depicts the last digits of the weights of 153 males in Data Set 1 “Body Data.” Do those digits appear to be from a
Expert Solution & Answer
Want to see the full answer?
Check out a sample textbook solution
Students have asked these similar questions
Not use ai please
Need help with the following statistic problems.
Need help with the following questions on statistics.
Chapter 7 Solutions
ELEMTARY STATISTICS W/STATLAB(LL)
Ch. 7.1 - Poll Results in the Media USA Today provided...Ch. 7.1 - Margin of Error For the poll described in Exercise...Ch. 7.1 - Notation For the poll described in Exercise 1,...Ch. 7.1 - Confidence Levels Given specific sample data, such...Ch. 7.1 - Finding Critical Values. In Exercises 58, find the...Ch. 7.1 - Finding Critical Values. In Exercises 58, find the...Ch. 7.1 - Finding Critical Values. In Exercises 58, find the...Ch. 7.1 - Finding Critical Values. In Exercises 58, find the...Ch. 7.1 - Formats of Confidence Intervals. In Exercises 912,...Ch. 7.1 - Formats of Confidence Intervals. In Exercises 912,...
Ch. 7.1 - Formats of Confidence Intervals. In Exercises 912,...Ch. 7.1 - Formats of Confidence Intervals. In Exercises 912,...Ch. 7.1 - Constructing and Interpreting Confidence...Ch. 7.1 - Constructing and Interpreting Confidence...Ch. 7.1 - Constructing and Interpreting Confidence...Ch. 7.1 - Constructing and Interpreting Confidence...Ch. 7.1 - Critical Thinking. In Exercises 1728, use the data...Ch. 7.1 - Critical Thinking. In Exercises 1728, use the data...Ch. 7.1 - Critical Thinking. In Exercises 1728, use the data...Ch. 7.1 - Critical Thinking. In Exercises 1728, use the data...Ch. 7.1 - Touch Therapy When she was 9 years of age, Emily...Ch. 7.1 - Critical Thinking. In Exercises 1728, use the data...Ch. 7.1 - Critical Thinking. In Exercises 1728, use the data...Ch. 7.1 - Critical Thinking. In Exercises 1728, use the data...Ch. 7.1 - Critical Thinking. In Exercises 1728, use the data...Ch. 7.1 - Critical Thinking. In Exercises 1728, use the data...Ch. 7.1 - Critical Thinking. In Exercises 1728, use the data...Ch. 7.1 - Critical Thinking. In Exercises 1728, use the data...Ch. 7.1 - Using Appendix B Data Sets. In Exercises 29 and...Ch. 7.1 - Using Appendix B Data Sets. In Exercises 29 and...Ch. 7.1 - Determining Sample Size. In Exercises 3138, use...Ch. 7.1 - Determining Sample Size. In Exercises 3138, use...Ch. 7.1 - Determining Sample Size. In Exercises 3138, use...Ch. 7.1 - Determining Sample Size. In Exercises 3138, use...Ch. 7.1 - Determining Sample Size. In Exercises 3138, use...Ch. 7.1 - Determining Sample Size. In Exercises 3138, use...Ch. 7.1 - Determining Sample Size. In Exercises 3138, use...Ch. 7.1 - Determining Sample Size. In Exercises 3138, use...Ch. 7.1 - Finite Population Correction Factor For Formulas...Ch. 7.1 - One-Sided Confidence Interval A one-sided claim...Ch. 7.1 - Coping with No Success According to the Rule of...Ch. 7.2 - In Exercises 13, refer to the accompanying screen...Ch. 7.2 - Statistical Literacy and Critical Thinking In...Ch. 7.2 - In Exercises 13, refer to the accompanying screen...Ch. 7.2 - Normality Requirement What does it mean when we...Ch. 7.2 - Using Correct Distribution. In Exercises 58,...Ch. 7.2 - Using Correct Distribution. In Exercises 58,...Ch. 7.2 - Using Correct Distribution. In Exercises 58,...Ch. 7.2 - Using Correct Distribution. In Exercises 58,...Ch. 7.2 - Confidence Intervals. In Exercises 924, construct...Ch. 7.2 - Confidence Intervals. In Exercises 924, construct...Ch. 7.2 - Confidence Intervals. In Exercises 924, construct...Ch. 7.2 - Confidence Intervals. In Exercises 924, construct...Ch. 7.2 - Confidence Intervals. In Exercises 924, construct...Ch. 7.2 - Confidence Intervals. In Exercises 924, construct...Ch. 7.2 - Confidence Intervals. In Exercises 924, construct...Ch. 7.2 - Confidence Intervals. In Exercises 924, construct...Ch. 7.2 - Confidence Intervals. In Exercises 924, construct...Ch. 7.2 - Confidence Intervals. In Exercises 924, construct...Ch. 7.2 - Confidence Intervals. In Exercises 924, construct...Ch. 7.2 - Confidence Intervals. In Exercises 924, construct...Ch. 7.2 - Confidence Intervals. In Exercises 924, construct...Ch. 7.2 - Confidence Intervals. In Exercises 924, construct...Ch. 7.2 - Confidence Intervals. In Exercises 924, construct...Ch. 7.2 - Confidence Intervals. In Exercises 924, construct...Ch. 7.2 - Appendix B Data Sets. In Exercises 2528, use the...Ch. 7.2 - Appendix B Data Sets. In Exercises 2528, use the...Ch. 7.2 - Appendix B Data Sets. In Exercises 2528, use the...Ch. 7.2 - Appendix B Data Sets. In Exercises 2528, use the...Ch. 7.2 - Sample Size. In Exercises 2936, find the sample...Ch. 7.2 - Sample Size. In Exercises 2936, find the sample...Ch. 7.2 - Sample Size. In Exercises 2936, find the sample...Ch. 7.2 - Sample Size. In Exercises 2936, find the sample...Ch. 7.2 - Sample Size. In Exercises 2936, find the sample...Ch. 7.2 - Sample Size. In Exercises 2936, find the sample...Ch. 7.2 - Sample Size. In Exercises 2936, find the sample...Ch. 7.2 - Sample Size. In Exercises 2936, find the sample...Ch. 7.2 - Confidence Interval with Known . In Exercises 37...Ch. 7.2 - Confidence Interval with Known . In Exercises 37...Ch. 7.2 - Finite Population Correction Factor If a simple...Ch. 7.3 - Brain Volume Using all of the brain volumes listed...Ch. 7.3 - Expressing Confidence Intervals Example 2 showed...Ch. 7.3 - Last Digit Analysis The dotplot below depicts the...Ch. 7.3 - Normality Requirement What is different about the...Ch. 7.3 - Finding Critical Values and Confidence Intervals....Ch. 7.3 - Finding Critical Values and Confidence Intervals....Ch. 7.3 - Finding Critical Values and Confidence Intervals....Ch. 7.3 - Finding Critical Values and Confidence Intervals....Ch. 7.3 - Finding Confidence Intervals. In Exercises 916,...Ch. 7.3 - Finding Confidence Intervals. In Exercises 916,...Ch. 7.3 - Finding Confidence Intervals. In Exercises 916,...Ch. 7.3 - Finding Confidence Intervals. In Exercises 916,...Ch. 7.3 - Finding Confidence Intervals. In Exercises 916,...Ch. 7.3 - Finding Confidence Intervals. In Exercises 916,...Ch. 7.3 - Finding Confidence Intervals. In Exercises 916,...Ch. 7.3 - Comparing Waiting Lines a. The values listed below...Ch. 7.3 - Large Data Sets from Appendix B. In Exercises 17...Ch. 7.3 - Large Data Sets from Appendix B. In Exercises 17...Ch. 7.3 - Determining Sample Size. In Exercises 1922, assume...Ch. 7.3 - Determining Sample Size. In Exercises 1922, assume...Ch. 7.3 - Determining Sample Size. In Exercises 1922, assume...Ch. 7.3 - Determining Sample Size. In Exercises 1922, assume...Ch. 7.3 - Finding Critical Values In constructing confidence...Ch. 7.3 - Finding Sample Size Instead of using Table 7-2 for...Ch. 7.4 - Replacement Why does the bootstrap method require...Ch. 7.4 - Bootstrap Sample Here is a random sample of...Ch. 7.4 - Bootstrap Sample Given the sample data from...Ch. 7.4 - Prob. 4BSCCh. 7.4 - In Exercises 58, use the relatively small number...Ch. 7.4 - In Exercises 58, use the relatively small number...Ch. 7.4 - In Exercises 58, use the relatively small number...Ch. 7.4 - In Exercises 58, use the relatively small number...Ch. 7 - Celebrities and the Law Here is a 95% confidence...Ch. 7 - Interpreting CI Write a brief statement that...Ch. 7 - Critical Value For the survey described in...Ch. 7 - Loose Change USA Today reported that 40% of people...Ch. 7 - Sample Size for Proportion Find the sample size...Ch. 7 - Sample Size for Mean Find the sample size required...Ch. 7 - Requirements A quality control analyst has...Ch. 7 - Degrees of Freedom In general, what does degrees...Ch. 7 - Critical Value Refer to Exercise 7 Requirements...Ch. 7 - Which Method? Refer to Exercise 7 Requirements and...Ch. 7 - Online News In a Harris poll of 2036 adults, 40%...Ch. 7 - Computers In order to better plan for student...Ch. 7 - Earthquake Magnitudes Listed below are Richter...Ch. 7 - Lefties There have been several studies conducted...Ch. 7 - Distributions Identify the distribution (normal,...Ch. 7 - Sample Size You have been hired by your new...Ch. 7 - Wristwatch Accuracy Students of the author...Ch. 7 - Wristwatch Accuracy Use the sample data from...Ch. 7 - Flight Arrivals. Listed below are the arrival...Ch. 7 - Flight Arrivals. Listed below are the arrival...Ch. 7 - Flight Arrivals. Listed below are the arrival...Ch. 7 - Flight Arrivals. Listed below are the arrival...Ch. 7 - Normal Distribution Using a larger data set than...Ch. 7 - Sample Size Find the sample size necessary to...Ch. 7 - Prob. 7CRECh. 7 - Normality Assessment A random sample consists of...Ch. 7 - Critical Thinking: What does the survey tell us?...Ch. 7 - Critical Thinking: What does the survey tell us?...Ch. 7 - Critical Thinking: What does the survey tell us?...Ch. 7 - Critical Thinking: What does the survey tell us?...Ch. 7 - Critical Thinking: What does the survey tell us?...
Knowledge Booster


Learn more about
Need a deep-dive on the concept behind this application? Look no further. Learn more about this topic, statistics and related others by exploring similar questions and additional content below.Similar questions
- Need help with these following statistic questions.arrow_forward2PM Tue Mar 4 7 Dashboard Calendar To Do Notifications Inbox File Details a 25/SP-CIT-105-02 Statics for Technicians Q-7 Determine the resultant of the load system shown. Locate where the resultant intersects grade with respect to point A at the base of the structure. 40 N/m 2 m 1.5 m 50 N 100 N/m Fig.- Problem-7 4 m Gradearrow_forwardNsjsjsjarrow_forward
- A smallish urn contains 16 small plastic bunnies - 9 of which are pink and 7 of which are white. 10 bunnies are drawn from the urn at random with replacement, and X is the number of pink bunnies that are drawn. (a) P(X=6)[Select] (b) P(X>7) ≈ [Select]arrow_forwardA smallish urn contains 25 small plastic bunnies - 7 of which are pink and 18 of which are white. 10 bunnies are drawn from the urn at random with replacement, and X is the number of pink bunnies that are drawn. (a) P(X = 5)=[Select] (b) P(X<6) [Select]arrow_forwardElementary StatisticsBase on the same given data uploaded in module 4, will you conclude that the number of bathroom of houses is a significant factor for house sellprice? I your answer is affirmative, you need to explain how the number of bathroom influences the house price, using a post hoc procedure. (Please treat number of bathrooms as a categorical variable in this analysis)Base on the same given data, conduct an analysis for the variable sellprice to see if sale price is influenced by living area. Summarize your finding including all regular steps (learned in this module) for your method. Also, will you conclude that larger house corresponding to higher price (justify)?Each question need to include a spss or sas output. Instructions: You have to use SAS or SPSS to perform appropriate procedure: ANOVA or Regression based on the project data (provided in the module 4) and research question in the project file. Attach the computer output of all key steps (number) quoted in…arrow_forward
- Elementary StatsBase on the given data uploaded in module 4, change the variable sale price into two categories: abovethe mean price or not; and change the living area into two categories: above the median living area ornot ( your two group should have close number of houses in each group). Using the resulting variables,will you conclude that larger house corresponding to higher price?Note: Need computer output, Ho and Ha, P and decision. If p is small, you need to explain what type ofdependency (association) we have using an appropriate pair of percentages. Please include how to use the data in SPSS and interpretation of data.arrow_forwardAn environmental research team is studying the daily rainfall (in millimeters) in a region over 100 days. The data is grouped into the following histogram bins: Rainfall Range (mm) Frequency 0-9.9 15 10 19.9 25 20-29.9 30 30-39.9 20 ||40-49.9 10 a) If a random day is selected, what is the probability that the rainfall was at least 20 mm but less than 40 mm? b) Estimate the mean daily rainfall, assuming the rainfall in each bin is uniformly distributed and the midpoint of each bin represents the average rainfall for that range. c) Construct the cumulative frequency distribution and determine the rainfall level below which 75% of the days fall. d) Calculate the estimated variance and standard deviation of the daily rainfall based on the histogram data.arrow_forwardAn electronics company manufactures batches of n circuit boards. Before a batch is approved for shipment, m boards are randomly selected from the batch and tested. The batch is rejected if more than d boards in the sample are found to be faulty. a) A batch actually contains six faulty circuit boards. Find the probability that the batch is rejected when n = 20, m = 5, and d = 1. b) A batch actually contains nine faulty circuit boards. Find the probability that the batch is rejected when n = 30, m = 10, and d = 1.arrow_forward
- Twenty-eight applicants interested in working for the Food Stamp program took an examination designed to measure their aptitude for social work. A stem-and-leaf plot of the 28 scores appears below, where the first column is the count per branch, the second column is the stem value, and the remaining digits are the leaves. a) List all the values. Count 1 Stems Leaves 4 6 1 4 6 567 9 3688 026799 9 8 145667788 7 9 1234788 b) Calculate the first quartile (Q1) and the third Quartile (Q3). c) Calculate the interquartile range. d) Construct a boxplot for this data.arrow_forwardPam, Rob and Sam get a cake that is one-third chocolate, one-third vanilla, and one-third strawberry as shown below. They wish to fairly divide the cake using the lone chooser method. Pam likes strawberry twice as much as chocolate or vanilla. Rob only likes chocolate. Sam, the chooser, likes vanilla and strawberry twice as much as chocolate. In the first division, Pam cuts the strawberry piece off and lets Rob choose his favorite piece. Based on that, Rob chooses the chocolate and vanilla parts. Note: All cuts made to the cake shown below are vertical.Which is a second division that Rob would make of his share of the cake?arrow_forwardThree players (one divider and two choosers) are going to divide a cake fairly using the lone divider method. The divider cuts the cake into three slices (s1, s2, and s3). If the choosers' declarations are Chooser 1: {s1 , s2} and Chooser 2: {s2 , s3}. Using the lone-divider method, how many different fair divisions of this cake are possible?arrow_forward
arrow_back_ios
SEE MORE QUESTIONS
arrow_forward_ios
Recommended textbooks for you
 Glencoe Algebra 1, Student Edition, 9780079039897...AlgebraISBN:9780079039897Author:CarterPublisher:McGraw Hill
 Holt Mcdougal Larson Pre-algebra: Student Edition...AlgebraISBN:9780547587776Author:HOLT MCDOUGALPublisher:HOLT MCDOUGAL
 College Algebra (MindTap Course List)AlgebraISBN:9781305652231Author:R. David Gustafson, Jeff HughesPublisher:Cengage Learning
Glencoe Algebra 1, Student Edition, 9780079039897...
Algebra
ISBN:9780079039897
Author:Carter
Publisher:McGraw Hill
Holt Mcdougal Larson Pre-algebra: Student Edition...
Algebra
ISBN:9780547587776
Author:HOLT MCDOUGAL
Publisher:HOLT MCDOUGAL
College Algebra (MindTap Course List)
Algebra
ISBN:9781305652231
Author:R. David Gustafson, Jeff Hughes
Publisher:Cengage Learning
Hypothesis Testing using Confidence Interval Approach; Author: BUM2413 Applied Statistics UMP;https://www.youtube.com/watch?v=Hq1l3e9pLyY;License: Standard YouTube License, CC-BY
Hypothesis Testing - Difference of Two Means - Student's -Distribution & Normal Distribution; Author: The Organic Chemistry Tutor;https://www.youtube.com/watch?v=UcZwyzwWU7o;License: Standard Youtube License