Videos
APPLY IT Foot-and-Mouth Epidemic In 2001, the United Kingdom suffered an epidemic of foot and mouth disease. The graph below shows the reported number of cattle (red) and pigs (blue) that were culled each month from mid-February through mid-October in order to stop the spread of disease.
Source: Department of Environment, Food and Rural Affairs, United Kingdom.
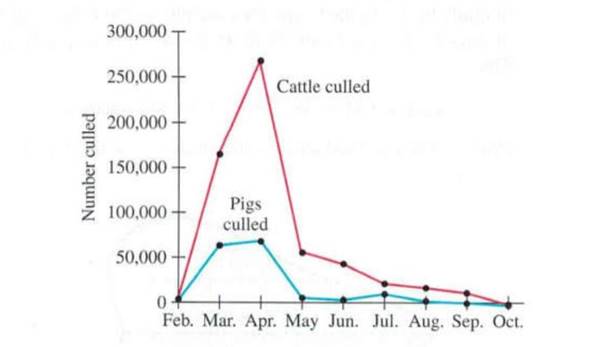
a. Estimate the total number of cattle that were culled each month from mid-February through mid-October and compare this with
b. Estimate the total number of pigs that were culled each month from mid-February through mid-October and compare this with
Want to see the full answer?
Check out a sample textbook solution
Chapter 7 Solutions
Pearson eText for Calculus for the Life Sciences -- Instant Access (Pearson+)


- Explain the conditions under Radius of Convergence which of Power Series is 0arrow_forwardExplain the key points and reasons for 12.8.2 (1) and 12.8.2 (2)arrow_forwardQ1: A slider in a machine moves along a fixed straight rod. Its distance x cm along the rod is given below for various values of the time. Find the velocity and acceleration of the slider when t = 0.3 seconds. t(seconds) x(cm) 0 0.1 0.2 0.3 0.4 0.5 0.6 30.13 31.62 32.87 33.64 33.95 33.81 33.24 Q2: Using the Runge-Kutta method of fourth order, solve for y atr = 1.2, From dy_2xy +et = dx x²+xc* Take h=0.2. given x = 1, y = 0 Q3:Approximate the solution of the following equation using finite difference method. ly -(1-y= y = x), y(1) = 2 and y(3) = −1 On the interval (1≤x≤3).(taking h=0.5).arrow_forward
- Consider the function f(x) = x²-1. (a) Find the instantaneous rate of change of f(x) at x=1 using the definition of the derivative. Show all your steps clearly. (b) Sketch the graph of f(x) around x = 1. Draw the secant line passing through the points on the graph where x 1 and x-> 1+h (for a small positive value of h, illustrate conceptually). Then, draw the tangent line to the graph at x=1. Explain how the slope of the tangent line relates to the value you found in part (a). (c) In a few sentences, explain what the instantaneous rate of change of f(x) at x = 1 represents in the context of the graph of f(x). How does the rate of change of this function vary at different points?arrow_forward1. The graph of ƒ is given. Use the graph to evaluate each of the following values. If a value does not exist, state that fact. и (a) f'(-5) (b) f'(-3) (c) f'(0) (d) f'(5) 2. Find an equation of the tangent line to the graph of y = g(x) at x = 5 if g(5) = −3 and g'(5) = 4. - 3. If an equation of the tangent line to the graph of y = f(x) at the point where x 2 is y = 4x — 5, find ƒ(2) and f'(2).arrow_forwardDoes the series converge or divergearrow_forward
- Suppose that a particle moves along a straight line with velocity v (t) = 62t, where 0 < t <3 (v(t) in meters per second, t in seconds). Find the displacement d (t) at time t and the displacement up to t = 3. d(t) ds = ["v (s) da = { The displacement up to t = 3 is d(3)- meters.arrow_forwardLet f (x) = x², a 3, and b = = 4. Answer exactly. a. Find the average value fave of f between a and b. fave b. Find a point c where f (c) = fave. Enter only one of the possible values for c. c=arrow_forwardplease do Q3arrow_forward
 Glencoe Algebra 1, Student Edition, 9780079039897...AlgebraISBN:9780079039897Author:CarterPublisher:McGraw Hill
 Holt Mcdougal Larson Pre-algebra: Student Edition...AlgebraISBN:9780547587776Author:HOLT MCDOUGALPublisher:HOLT MCDOUGAL
 Algebra: Structure And Method, Book 1AlgebraISBN:9780395977224Author:Richard G. Brown, Mary P. Dolciani, Robert H. Sorgenfrey, William L. ColePublisher:McDougal Littell
 Big Ideas Math A Bridge To Success Algebra 1: Stu...AlgebraISBN:9781680331141Author:HOUGHTON MIFFLIN HARCOURTPublisher:Houghton Mifflin Harcourt
 College Algebra (MindTap Course List)AlgebraISBN:9781305652231Author:R. David Gustafson, Jeff HughesPublisher:Cengage Learning
 Linear Algebra: A Modern IntroductionAlgebraISBN:9781285463247Author:David PoolePublisher:Cengage Learning