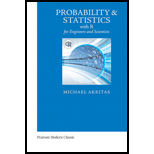
Pearson eText for Probability & Statistics for Engineers and Scientists with R -- Instant Access (Pearson+)
1st Edition
ISBN: 9780137548552
Author: Michael Akritas
Publisher: PEARSON+
expand_more
expand_more
format_list_bulleted
Question
error_outline
This textbook solution is under construction.
Students have asked these similar questions
Find the cdf of a random variable Y whose pdf is given by;
2, 0≤x≤1
1/3, 0≤x≤1
a) f(x)=3, 2≤x≤4
0, elsewhere
2, 1≤x≤2
b) f(x)=
(3-x)2, 2≤x≤3
0, elsewhere
There are m users who share a computer system. Each user alternates between "thinking" intervals whose durations are
independent exponentially distributed with parameter Y, and an "active" mode that starts by submitting a service re-
quest. The server can only serve one request at a time, and will serve a request completely before serving other requests.
The service times of different requests are independent exponentially distributed random variables with parameter μ,
and also independent of the thinking times of the users. Construct a Markov chain model and derive the steady-state
distribution of the number of pending requests, including the one presently served, if any.
Phase 1C: Question Writing and Approval
Based on either your own discussion post or ideas sparked from what others mentioned, select two questions you’d like to answer by analyzing data from Census at School.
You will need to select one question from the qualitative category, and one question from the quantitative category. Remember the intent of these questions is to make comparisons and analyze data to eventually make inferences about and possibly draw conclusions about the larger population. You should make notes as you gather your data on what things might be missing, what factors might be contributing to this data, and what questions you still have.
Qualitative Only Options
How are males and females similar or different in their favorite subjects in school?
Quantitative Options
Do the number of texts sent differ between freshmen and seniors in high school?
Knowledge Booster
Similar questions
- pls help asap. show in the diagram by filling it outarrow_forwardpls help asaparrow_forwardProblem 3 Ten measurements of an impurity concentration in a process stream have been recorded. The sample mean is 87ppm and the sample standard deviation is ±13 ppm. Consider the null hypothesis that the impurity concentration has a true mean μo. Part A: Desired Probability that the sample mean will satisfy the null hypothesis: P = 0.4 Part B: Using the chart below, determine the4 highest value of the true mean that will lead to the null hypothesis being accepted with the probability assigned in Part A 1.00 0.90 0.80 0.70 0.60 0.50 0.40 Probability of accepting Ho 0.30 0.20 0.10 1 ° 0 30 40 50 75 100 10 0.2 0.4 0.6 0.8 1.0 1.2 =2.5 1.4 1.6 1.8 2.0 2.2 2.4 2.6 d 2.8 3.0 3.2arrow_forward
- Problem 2 A chemical reactor system has been designed to perform optimally when operated at 150°C. The hypothesis test that will be used for evaluating the operating temperature will rely on 10 successive temperature measurements and will assign a 95% confidence interval for the result. The reactor system is judged to have a standard deviation of ±3°C. Part A: Actual operating temperature of the process T[°C] = 152.90 Part B: What is the probability that the hypothesis test for operating at 150°C described above will give a false acceptance (i.e., a type II error)?arrow_forwardProblem 1 An airport is served with an average of 10 departures per day to your desired destination. However, all these flights leave at random times. You are trying to decide how long you are willing to wait to catch the next flight after you arrive at airport. Part A: Acceptable waiting time: T [min] = 78min Part B: What is the probability there will be exactly one departure during this waiting time? Part C: What is the probability there will be exactly no departure during this waiting time? Part D: Which calculation (B or C) should you use to make your decision to wait or leave? Why?arrow_forwardProblem 5 Consider the hospital admissions table presented in the lecture: 刊 Outcome LWBS Admitted Hospital 1 195 Hospital 2 270 Hospital 3 246 Hospital 4 242 1277 1558 1350 984 Not Admitted 3820 5163 4728 3103 Part A: What is the conditional probability that you were admitted if you went to hospital 3? Part B: What is the conditional probability that you went to hospital 3 if you were admitted?arrow_forward
- Use NR method for one variable to find v 1 G2=1 if diode current is (e40v2 - 1) use V₂(0)=0.1 volt. 1 A GI=2arrow_forwardSuppose that a coin is tossed twice so that the sample space is S= {HH, HT, TH, TT}. Let X represent the number of heads that can come up. With each sample point we can associate a number for X as shown in Table. Thus, for example, in the case of HH (i.e., 2 heads), X =2 while for TH (1 head), X = 1. It follows that X is a random variable.arrow_forward-x² The normal distribution has p(x) = e 2 determine the CDF in terms Erf, mean and standard deviation.arrow_forward
- Find the probability in tossing a fair coin four times, there will appear a) 3H and 1T b) 2T and 2H using binomial distribution and assume coin has p(H)=1/3.arrow_forwardThe joint pdf of random variables X=1, 2 and Y=1, 2, 3 is P(X,Y)= X 10.05 Find (a) The value of k. (c) P(X>1, Y <2). Y 0.2 0.18 0.15] (b) the marginal probability function of X and Y. (d) Ex, Hyarrow_forwardThe conditional probability function for the random variables X and Y is 0 P(Y/X) = x0 [0.9 10.1 y 1 2 0.1 0 0.8 0.1 2 0 0.1 0.9. With P(x=0)=0.2, P(x-1)=0.4. Find P(X,Y), Hx, My, E(XY), OXY.arrow_forward
arrow_back_ios
SEE MORE QUESTIONS
arrow_forward_ios
Recommended textbooks for you
 A First Course in Probability (10th Edition)ProbabilityISBN:9780134753119Author:Sheldon RossPublisher:PEARSON

A First Course in Probability (10th Edition)
Probability
ISBN:9780134753119
Author:Sheldon Ross
Publisher:PEARSON
