
Videos
Using Correct Distribution. In Exercises 5–8, assume that we want to construct a confidence interval. Do one of the following, as appropriate: (a) Find the critical value tα/2, (b) find the critical value zα/2 or (c) state that neither the
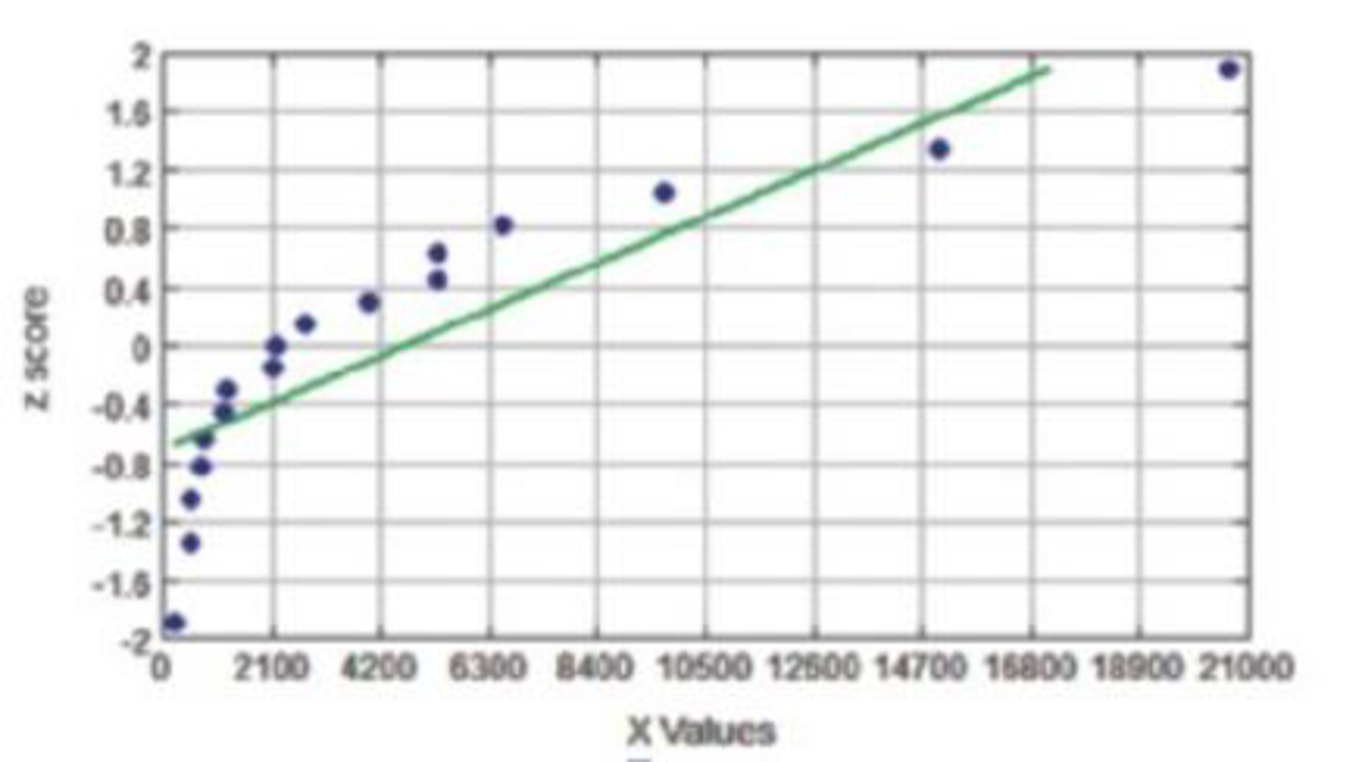
5. Miami Heat Salaries Confidence level is 95%, σ is not known, and the normal quantile plot of the 17 salaries (thousands of dollars) of Miami Heat basketball players is as shown.

Trending nowThis is a popular solution!

Learn your wayIncludes step-by-step video

Chapter 7 Solutions
Essentials of Statistics (6th Edition)
Additional Math Textbook Solutions
Statistics for Psychology
Introductory Statistics
An Introduction to Mathematical Statistics and Its Applications (6th Edition)
Basic Business Statistics, Student Value Edition (13th Edition)
Elementary Statistics: Picturing the World (7th Edition)


- Just answer the number 7 and 8 in 4 decimaalarrow_forwardLet x be a random variable that represents blood glucose level after a 12-hour fast. Let y be a random variable representing blood glucose level 1 hour after drinking sugar water (after the 12-hour fast). Units are in milligrams per 10 milliliters (mg/10 ml). A random sample of eight adults gave the following information. I need help with Part A, B, and Carrow_forwardData for question on screenshot. For each of the surveys, include the Summary Statistics and your Confidence Level/Alpha. At least 90% Confidence is recommended for all 3. Television Survey: In a recent survey, it was stated that Americans watch television on average four hours per day. Assume that σ = 2. Using your class (or any 20 – 30 people) as the sample, conduct a hypothesis test to determine if the average for students at your school is lower. Do not make up your data. Write your answers in the tables below. Sample Mean Sample Standard Deviation Confidence Level What is your null hypothesis? What is your alternative hypothesis, ? In words, define the random variable. Hint: ___ = ____ The distribution to use for the test is… Determine the test statistic using your data.arrow_forward
- Blood pressure in women: The three quartiles for systolic blood pressure in a sample of 1213 women between the ages of 20 Delivery and 29 were Q,- 103, Q, = 105, and Q = 118. Part: 0/3 Part 1 of 3 Find the IQR. IQR = de home pg up pg dn ort sc delete end + & num lock backspace %23 $ 6. 8. 6. フ 9arrow_forwardBighorn sheep are beautiful wild animals found throughout the western United States. Let x be the age of a bighorn sheep (in years), and let y be the mortality rate (percent that die) for this age group. For example, x = 1, y = 14 means that 14% of the bighorn sheep between 1 and 2 years old died. A random sample of Arizona bighorn sheep gave the following information: x 1 2 3 4 5 y 13.8 19.3 14.4 19.6 20.0 Σx = 15; Σy = 87.1; Σx2 = 55; Σy2 = 1554.45; Σxy = 274b) Find the equation of the least-squares line. (Round your answers to two decimal places.) ŷ = + x (c) Find r. Find the coefficient of determination r2. (Round your answers to three decimal places.) r = r2 = d) Test the claim that the population correlation coefficient is positive at the 1% level of significance. (Round your test statistic to three decimal places.) t =arrow_forwardBighorn sheep are beautiful wild animals found throughout the western United States. Let x be the age of a bighorn sheep (in years), and let y be the mortality rate (percent that die) for this age group. For example, x = 1, y = 14 means that 14% of the bighorn sheep between 1 and 2 years old died. A random sample of Arizona bighorn sheep gave the following information: x 1 2 3 4 5 y 15.8 18.1 14.4 19.6 20.0 Σx = 15; Σy = 87.9; Σx2 = 55; Σy2 = 1,568.77; Σxy = 273.6 (a) Find x, y, b, and the equation of the least-squares line. (Round your answers for x and y to two decimal places. Round your least-squares estimates to three decimal places.) x = y = b = ŷ = + xarrow_forward
- Xn be a random sample from Let Xi, X2, f(x;e)- DeI (0.00x). Find a 100y or (1-a) 100 Percent confidence interval for the mean of the population: - oxarrow_forwardBighorn sheep are beautiful wild animals found throughout the western United States. Let x be the age of a bighorn sheep (in years), and let y be the mortality rate (percent that die) for this age group. For example, x = 1, y = 14 means that 14% of the bighorn sheep between 1 and 2 years old died. A random sample of Arizona bighorn sheep gave the following information: x 1 2 3 4 5 y 15.8 17.3 14.4 19.6 20.0 Σx = 15; Σy = 87.1; Σx2 = 55; Σy2 = 1,540.45; Σxy = 272 (a) Find x, y, b, and the equation of the least-squares line. (Round your answers for x and y to two decimal places. Round your least-squares estimates to three decimal places.) x = y = b = ŷ = + x (b) Draw a scatter diagram for the data. Plot the least-squares line on your scatter diagram. (c) Find the sample correlation coefficient r and the coefficient of determination r2. (Round your answers to three decimal places.) r = r2 = What percentage of variation in y is…arrow_forwardEvery year, the students at a school are given a musical aptitude test that rates them from 0 (no musical aptitude) to 5 (high musical aptitude). This year's results were: "Aptitude Score" "Frequency" If 0 1 2 3 4 5 sum 3 6 4 3 2 4 22 0 0 6 The mode aptitude score: 2,5 there is no mode.) 8 8 20 51 ✓o The mean aptitude score: Σ(xf) Σ(5) Please find the median aptitude score by a TI-84: 2.5 2.32 (Round to 2 decimal place.) X x (Please separate your answers by, in bimodal situation. Enter DNE ifarrow_forward
 Glencoe Algebra 1, Student Edition, 9780079039897...AlgebraISBN:9780079039897Author:CarterPublisher:McGraw Hill