Pregnancy. For Exercises 87–90 , use the following graph of a woman’s “stress test.” This graph shows the size of a pregnant woman’s contractions as a function of time. Pregnancy. For Exercises 87–90, use the following graph of a woman’s “stress test.” This graph shows the size of a pregnant woman’s contractions as a function of time. The greatest integer function f ( x ) = 〚 x 〛 is defined as follows: 〚 x 〛 is the greatest integer that is less than or equal to x . For example, if x = 3.74 x=3.74, then 〚 x 〛 = 3 ; and if x = − 0.98 , then 〚 x 〛 = − 1 . Graph the greatest integer function for − 5 ≤ x ≤ 5 . (The notation f ( x ) = INT ( x ) is used by many graphing calculators and computers.)
Pregnancy. For Exercises 87–90 , use the following graph of a woman’s “stress test.” This graph shows the size of a pregnant woman’s contractions as a function of time. Pregnancy. For Exercises 87–90, use the following graph of a woman’s “stress test.” This graph shows the size of a pregnant woman’s contractions as a function of time. The greatest integer function f ( x ) = 〚 x 〛 is defined as follows: 〚 x 〛 is the greatest integer that is less than or equal to x . For example, if x = 3.74 x=3.74, then 〚 x 〛 = 3 ; and if x = − 0.98 , then 〚 x 〛 = − 1 . Graph the greatest integer function for − 5 ≤ x ≤ 5 . (The notation f ( x ) = INT ( x ) is used by many graphing calculators and computers.)
Solution Summary: The author explains that the graph of the greatest integer function f=x is not continuous at integers.
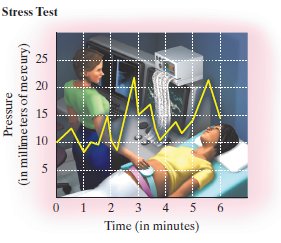
Pregnancy.ForExercises 87–90, use the following graph of a woman’s “stress test.” This graph shows the size of a pregnant woman’s contractions as a function of time. Pregnancy. For Exercises 87–90, use the following graph of a woman’s “stress test.” This graph shows the size of a pregnant woman’s contractions as a function of time.
The greatest integer function
f
(
x
)
=
〚
x
〛
is defined as follows:
〚
x
〛
is the greatest integer that is less than or equal to x. For example, if
x
=
3.74
x=3.74, then
〚
x
〛
=
3
; and if
x
=
−
0.98
, then
〚
x
〛
=
−
1
. Graph the greatest integer function for
−
5
≤
x
≤
5
. (The notation
f
(
x
)
=
INT
(
x
)
is used by many graphing calculators and computers.)
A research study in the year 2009 found that there were 2760 coyotes
in a given region. The coyote population declined at a rate of 5.8%
each year.
How many fewer coyotes were there in 2024 than in 2015?
Explain in at least one sentence how you solved the problem. Show
your work. Round your answer to the nearest whole number.
Answer the following questions related to the following matrix
A =
3
³).
Need a deep-dive on the concept behind this application? Look no further. Learn more about this topic, algebra and related others by exploring similar questions and additional content below.


 Algebra & Trigonometry with Analytic GeometryAlgebraISBN:9781133382119Author:SwokowskiPublisher:Cengage
 Glencoe Algebra 1, Student Edition, 9780079039897...AlgebraISBN:9780079039897Author:CarterPublisher:McGraw Hill
 Algebra and Trigonometry (MindTap Course List)AlgebraISBN:9781305071742Author:James Stewart, Lothar Redlin, Saleem WatsonPublisher:Cengage Learning
 Big Ideas Math A Bridge To Success Algebra 1: Stu...AlgebraISBN:9781680331141Author:HOUGHTON MIFFLIN HARCOURTPublisher:Houghton Mifflin Harcourt
 College Algebra (MindTap Course List)AlgebraISBN:9781305652231Author:R. David Gustafson, Jeff HughesPublisher:Cengage Learning