
The effects of tax on
Concept Introduction:
Tax:
Tax is a compulsory levy on the citizens by the government.
Demand:
Demand is a quantity of a commodity that a consumer is willing to purchase at a particular
Supply:
Supply is the quantity of a commodity that a producer is willing to sell at a particular price in a given period of time.
It is the amount of goods and services a particular amount of money can purchase. It is basically the purchasing power of money.
Explanation of Solution
Let us take the example of a motor bike. Suppose, the cost of the motor bike is $100 and the government imposes 10% tax on the sale of it. Now, for the consumer earlier it was costing $100 but now it is costing $110, thus it has become relatively expensive. In other words, the real income of the consumer has reduced. With the reduction in the real income and substitution effect, the consumer will demand less quantity, that is, the consumer will move along the demand curve towards higher price and lesser quantity. Being conscious of this, the producer will also take an action. The supply curve will shift leftward implying less supply.
Thus, the taxes reduce both demand and supply.
As we can observe in the figure, where on vertical axis we have prices and on horizontal axis we have quantity, that before the imposition of tax, the
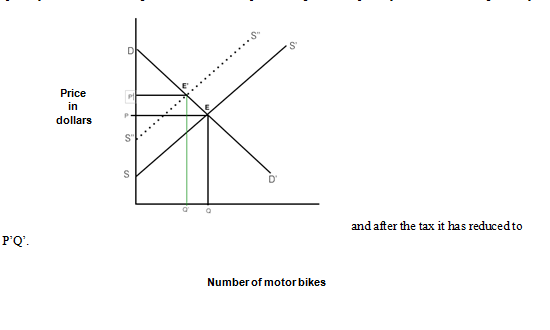 and after the tax it has reduced to P’Q’.
Want to see more full solutions like this?

- a-c pleasearrow_forwardd-farrow_forwardPART II: Multipart Problems wood or solem of triflussd aidi 1. Assume that a society has a polluting industry comprising two firms, where the industry-level marginal abatement cost curve is given by: MAC = 24 - ()E and the marginal damage function is given by: MDF = 2E. What is the efficient level of emissions? b. What constant per-unit emissions tax could achieve the efficient emissions level? points) c. What is the net benefit to society of moving from the unregulated emissions level to the efficient level? In response to industry complaints about the costs of the tax, a cap-and-trade program is proposed. The marginal abatement cost curves for the two firms are given by: MAC=24-E and MAC2 = 24-2E2. d. How could a cap-and-trade program that achieves the same level of emissions as the tax be designed to reduce the costs of regulation to the two firms?arrow_forward
- Only #4 please, Use a graph please if needed to help provearrow_forwarda-carrow_forwardFor these questions, you must state "true," "false," or "uncertain" and argue your case (roughly 3 to 5 sentences). When appropriate, the use of graphs will make for stronger answers. Credit will depend entirely on the quality of your explanation. 1. If the industry facing regulation for its pollutant emissions has a lot of political capital, direct regulatory intervention will be more viable than an emissions tax to address this market failure. 2. A stated-preference method will provide a measure of the value of Komodo dragons that is more accurate than the value estimated through application of the travel cost model to visitation data for Komodo National Park in Indonesia. 3. A correlation between community demographics and the present location of polluting facilities is sufficient to claim a violation of distributive justice. olsvrc Q 4. When the damages from pollution are uncertain, a price-based mechanism is best equipped to manage the costs of the regulator's imperfect…arrow_forward
- For environmental economics, question number 2 only please-- thank you!arrow_forwardFor these questions, you must state "true," "false," or "uncertain" and argue your case (roughly 3 to 5 sentences). When appropriate, the use of graphs will make for stronger answers. Credit will depend entirely on the quality of your explanation. 1. If the industry facing regulation for its pollutant emissions has a lot of political capital, direct regulatory intervention will be more viable than an emissions tax to address this market failure. cullog iba linevoz ve bubivorearrow_forwardExercise 3 The production function of a firm is described by the following equation Q=10,000-3L2 where L stands for the units of labour. a) Draw a graph for this equation. Use the quantity produced in the y-axis, and the units of labour in the x-axis. b) What is the maximum production level? c) How many units of labour are needed at that point? d) Provide one reference with you answer.arrow_forward
- Exercise 1 Consider the market supply curve which passes through the intercept and from which the market equilibrium data is known, this is, the price and quantity of equilibrium PE=50 and QE=2000. Considering those two points, find the equation of the supply. Draw a graph of this line. Provide one reference with your answer. Exercise 2 Considering the previous supply line, determine if the following demand function corresponds to the market demand equilibrium stated above. QD=3000-2p.arrow_forwardConsider the market supply curve which passes through the intercept and from which the marketequilibrium data is known, this is, the price and quantity of equilibrium PE=50 and QE=2000.a. Considering those two points, find the equation of the supply. b. Draw a graph of this line.arrow_forwardGovernment Purchases and Tax Revenues A B GDP T₂ Refer to the diagram. Discretionary fiscal policy designed to slow the economy is illustrated by Multiple Choice the shift of curve T₁ to T2. a movement from d to balong curve T₁.arrow_forward

 Principles of Economics (12th Edition)EconomicsISBN:9780134078779Author:Karl E. Case, Ray C. Fair, Sharon E. OsterPublisher:PEARSON
 Engineering Economy (17th Edition)EconomicsISBN:9780134870069Author:William G. Sullivan, Elin M. Wicks, C. Patrick KoellingPublisher:PEARSON
 Principles of Economics (MindTap Course List)EconomicsISBN:9781305585126Author:N. Gregory MankiwPublisher:Cengage Learning
 Managerial Economics: A Problem Solving ApproachEconomicsISBN:9781337106665Author:Luke M. Froeb, Brian T. McCann, Michael R. Ward, Mike ShorPublisher:Cengage Learning
 Managerial Economics & Business Strategy (Mcgraw-...EconomicsISBN:9781259290619Author:Michael Baye, Jeff PrincePublisher:McGraw-Hill Education