
Concept explainers
Subpart (a):
The impact of falling prices of computers and its impact on typewriters.
Subpart (a):
Explanation of Solution
When the cost of producing computers falls, the supply of the computers in the economy will increase. This will lead to a rightward shift in the supply curve of the computers. As a result of this rightward shift, the
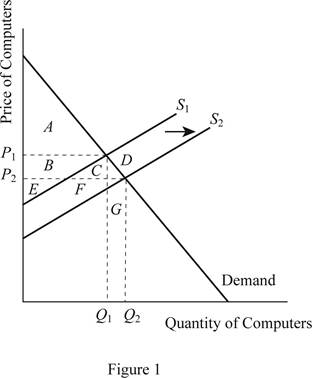
From the above graph, it can be identified that when there is a rightward shift in the supply curve for the computers due to the fall in the cost of producing the computers, there will be a new equilibrium and this will be determined below the existing one. As a result of this, the price will fall from P1 to P2 and the quantity will rise from Q1 to Q2.
Before the shift in the supply curve, the
Before the shift in the supply curve towards the right due to the fall in the cost of producing computer, the
The quantity demanded increases from Q1 to Q2, which means that more quantity is sold and it increases the producer surplus, but at the same time the fall in the price reduces the producer surplus. Thus, the total change in the total surplus can be calculated by summating the changes in the consumer surplus and the producer surplus as follows:
Thus, the total surplus increases by the area of C+D+F+G.
Concept introduction:
Consumer surplus: It is the difference between the highest willing price of the consumer and the actual price that the consumer pays.
Producer surplus: It is the difference between the minimum accepted price for the producer and the actual price received by the producer.
Equilibrium price: It is the market price determined by equating the supply to the
Subpart (b):
The impact of falling prices of computers and its impact on typewriters.
Subpart (b):
Explanation of Solution
Typewriters and the computers are the substitutes and the fall in the cost of production of the computers implies a fall in the price of computers as explained above. When the computers become cheaper, people will substitute the typewriters with the computers. As a result, there will be a decline in the demand for typewriters and this leads to the downward or leftward shift in the demand curve for the typewriters. This can be illustrated as follows:
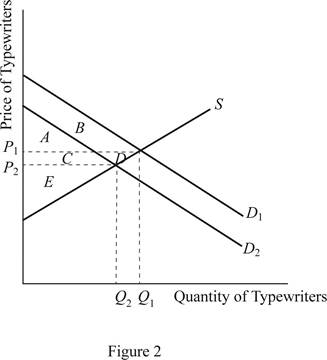
From the above graph of the typewriter market, it can be easily identified that the fall in the production cost of the computers leads to substitution of typewriters with computers. As a result, the demand curve for the typewriter shifts leftward and it results in the lower new equilibrium price of typewriters but lower quantity demanded of typewriters.
Before the shift in the demand curve, the consumer surplus was the area of A+B and after the shift in the demand curve, the consumer surplus changes to area of A+C. Thus, the consumer surplus changes by C - B.
The producer surplus prior to the shift in the demand curve was area of C+E+D. It changes only to the area of D. Thus, the typewriter producers face a loss of surplus by the area of C+D. Hence, the technological advancement is harmful to the typewriter producers because it reduces price, quantity demanded of typewriter and the producer surplus.
Concept introduction:
Consumer surplus: It is the difference between the highest willing price of the consumer and the actual price that the consumer pays.
Producer surplus: It is the difference between the minimum accepted price for the producer and the actual price received by the producer.
Equilibrium price: It is the market price determined by equating the supply to the demand. At this equilibrium point, the supply will be equal to the demand and there will be no excess demand or excess supply in an economy. Thus, the economy will be at equilibrium.
Subpart (c):
The impact of falling prices of computers and its impact on typewriters.
Subpart (c):
Explanation of Solution
Software and the computers are the complementary goods and they are correlated positively. When the demand for computers increases, it will lead to an increase in the demand for the software. Thus, the market for the software will witness a shift in the demand curve for the software, which will shift the demand curve towards the right. As a result, the price of the software will increase and the quantity demanded will also increase. This can be illustrated as follows:
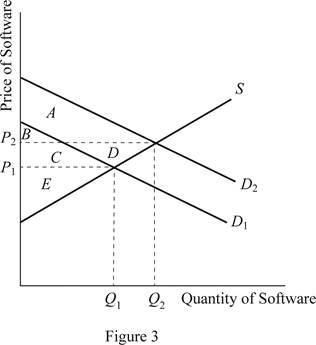
When the demand for the software increases, it will lead to a rightward shift in the demand curve for the software. Thus, as a result of the rightward shift in the demand curve, the D2 will form and it will intersect with the supply curve at a point higher than the existing point to determine new higher equilibrium price and quantity demanded. Thus, the price becomes P2 and the quantity becomes Q2.
Prior to the shift in the demand curve, the consumer surplus was area of B+C and it changes to area of A+B. Thus, the net change in the consumer surplus is by the area of A - C. Similarly, the producer surplus was the area of E before the shift in the demand. It increased to area of C+D+E, where the net increase in the producer surplus is by the area of C+D.
Thus, with the technological advancement, the software producers will be happy because it increases the price of the software, quantity demanded of the software along with the producer surplus.
Concept introduction:
Consumer surplus: It is the difference between the highest willing price of the consumer and the actual price that the consumer pays.
Producer surplus: It is the difference between the minimum accepted price for the producer and the actual price received by the producer.
Equilibrium price: It is the market price determined by equating the supply to the demand. At this equilibrium point, the supply will be equal to the demand and there will be no excess demand or excess supply in an economy. Thus, the economy will be at equilibrium.
Subpart (d):
The impact of falling prices of computers and its impact on typewriters.
Subpart (d):
Explanation of Solution
This analysis helps us to understand how the computer-associated technological markets develop, when there is a technological advancement in the economy. When there is a technological advancement that reduces the cost of producing computers, it will lead to the development of complementary markets such as software. Bill Gates, the founder of Microsoft software is world famous example. His company produces different types of software required for the computers and the analysis helps us to explain how Bill Gates emerged as one of the richest people in the world.
Concept introduction:
Consumer surplus: It is the difference between the highest willing price of the consumer and the actual price that the consumer pays.
Producer surplus: It is the difference between the minimum accepted price for the producer and the actual price received by the producer.
Equilibrium price: It is the market price determined by equating the supply to the demand. At this equilibrium point, the supply will be equal to the demand and there will be no excess demand or excess supply in an economy. Thus, the economy will be at equilibrium.
Want to see more full solutions like this?


- Answerarrow_forwardM” method Given the following model, solve by the method of “M”. (see image)arrow_forwardAs indicated in the attached image, U.S. earnings for high- and low-skill workers as measured by educational attainment began diverging in the 1980s. The remaining questions in this problem set use the model for the labor market developed in class to walk through potential explanations for this trend. 1. Assume that there are just two types of workers, low- and high-skill. As a result, there are two labor markets: supply and demand for low-skill workers and supply and demand for high-skill workers. Using two carefully drawn labor-market figures, show that an increase in the demand for high skill workers can explain an increase in the relative wage of high-skill workers. 2. Using the same assumptions as in the previous question, use two carefully drawn labor-market figures to show that an increase in the supply of low-skill workers can explain an increase in the relative wage of high-skill workers.arrow_forward
- Published in 1980, the book Free to Choose discusses how economists Milton Friedman and Rose Friedman proposed a one-sided view of the benefits of a voucher system. However, there are other economists who disagree about the potential effects of a voucher system.arrow_forwardThe following diagram illustrates the demand and marginal revenue curves facing a monopoly in an industry with no economies or diseconomies of scale. In the short and long run, MC = ATC. a. Calculate the values of profit, consumer surplus, and deadweight loss, and illustrate these on the graph. b. Repeat the calculations in part a, but now assume the monopoly is able to practice perfect price discrimination.arrow_forwardThe projects under the 'Build, Build, Build' program: how these projects improve connectivity and ease of doing business in the Philippines?arrow_forward

 Economics (MindTap Course List)EconomicsISBN:9781337617383Author:Roger A. ArnoldPublisher:Cengage Learning
 Exploring EconomicsEconomicsISBN:9781544336329Author:Robert L. SextonPublisher:SAGE Publications, Inc
 Managerial Economics: A Problem Solving ApproachEconomicsISBN:9781337106665Author:Luke M. Froeb, Brian T. McCann, Michael R. Ward, Mike ShorPublisher:Cengage Learning
 Economics Today and Tomorrow, Student EditionEconomicsISBN:9780078747663Author:McGraw-HillPublisher:Glencoe/McGraw-Hill School Pub Co