Concept explainers
Videos
1 a.
Calculate the gross profit for each year under periodic method using FIFO method.
1 a.
Explanation of Solution
Gross margin (gross profit): Gross margin is the amount of revenue earned from goods sold over the costs incurred for the goods sold.
FIFO: In First-in-First-Out method, items purchased initially are sold first. So, the value of the ending inventory consist the recent cost for the remaining unsold items.
Compute the gross profit for each year:
| Particulars | 2015 | 2016 | 2017 | 2018 |
| Sales | $400,000 | $550,000 | $750,000 | $600,000 |
| Less: Cost of goods sold (2) | ($160,000) | ($215,500) | ($286,500) | ($222,500) |
| Gross profit | $240,000 | $334,500 | $463,500 | $377,500 |
Table (1)
Thus, the gross profit for 2015, 2016, 2017, and 2018 are $240,000, $334,500, $463,500, and $377,500 respectively.
Working note 1: Determine the ending inventory:
| Computation of cost of ending inventory | ||||
| Particulars | 2015 | 2016 | 2017 | 2018 |
| Total production (A) | $200,000 | $234,000 | $247,000 | $240,500 |
| Units purchased (B) | 100,000 | 120,000 | 130,000 | 130,000 |
| Per unit cost | $2.00 | $1.95 | $1.90 | $1.85 |
| Units in ending inventory (D) | 20,000 | 30,000 | 10,000 | 20,000 |
| Cost of ending inventory | $40,000 | $58,500 | $19,000 | $37,000 |
Table (2)
Working note 2: Determine the cost of goods sold:
| Particulars | 2015 | 2016 | 2017 | 2018 |
| Beginning inventory | $0 | $40,000 | $58,500 | $19,000 |
| Add: Units purchased | $200,000 | $234,000 | $247,000 | $240,500 |
| Goods available for sale | $200,000 | $274,000 | $305,500 | $259,500 |
| Less: Ending inventory (1) | ($40,000) | ($58,500) | ($19,000) | ($37,000) |
| Cost of goods sold | $160,000 | $215,500 | $286,500 | $222,500 |
Table (3)
1 b.
Calculate the gross profit for each year under periodic method using LIFO method.
1 b.
Explanation of Solution
LIFO: In Last-in-First-Out method, items purchased recently are sold first. So, the value of the ending inventory consist the initial cost for the remaining unsold items.
Compute the gross profit for each year:
| Particulars | 2015 | 2016 | 2017 | 2018 |
| Sales | $400,000 | $550,000 | $750,000 | $600,000 |
| Cost of goods sold (6) | ($160,000) | ($214,500) | ($285,500) | ($222,000) |
| Gross profit | $240,000 | $335,500 | $464,500 | $378,000 |
Table (4)
Thus, the gross profit for 2015, 2016, 2017, and 2018 are $240,000, $335,500, $464,500, and $378,000 respectively.
Working note 3: Determine the ending inventory:
| Computation of cost of ending inventory | ||||
| Particulars | 2015 | 2016 | 2017 | 2018 |
| Total production | $200,000 | $234,000 | $247,000 | $240,500 |
| Units purchased | 100,000 | 120,000 | 130,000 | 130,000 |
| Per unit cost | $2.00 | $1.95 | $1.90 | $1.85 |
| Units in ending inventory | 20,000 | 30,000 | 10,000 | 20,000 |
| Cost of ending inventory | $40,000 | $59,500 | $20,000 | $38,500 |
Table (5)
Working note 4: Calculate ending inventory for the year 2016:
Working note 5: Calculate ending inventory for the year 2016:
Working note 6: Determine the cost of goods sold:
| Particulars | 2015 | 2016 | 2017 | 2018 |
| Beginning inventory | $0 | $40,000 | $58,500 | $20,000 |
| Add: Units purchased | $200,000 | $234,000 | $247,000 | $240,500 |
| Goods available for sale | $200,000 | $274,000 | $305,500 | $260,500 |
| Less: Ending inventory | ($40,000) | ($59,500) | ($20,000) | ($38,500) |
| Cost of goods sold | $160,000 | $214,500 | $285,500 | $222,000 |
Table (6)
1 c.
Calculate the gross profit for each year under periodic method using average cost method.
1 c.
Explanation of Solution
Average cost method: Under average cost method, company calculates a new average after every purchase. It is determined by dividing the cost of goods available for sale by the units on hand.
Compute the gross profit for each year:
| Particulars | 2015 | 2016 | 2017 | 2018 |
| Sales | $400,000 | $550,000 | $750,000 | $600,000 |
| Cost of goods sold (7) | ($160,000) | ($215,290) | ($286,600) | ($222,530) |
| Gross profit | $240,000 | $334,710 | $463,400 | $377,470 |
Table (7)
Thus, the gross profit for 2015, 2016, 2017, and 2018 are $240,000, $334,710, $463,400, and $377,470 respectively.
Working note 7: Determine the cost of goods sold:
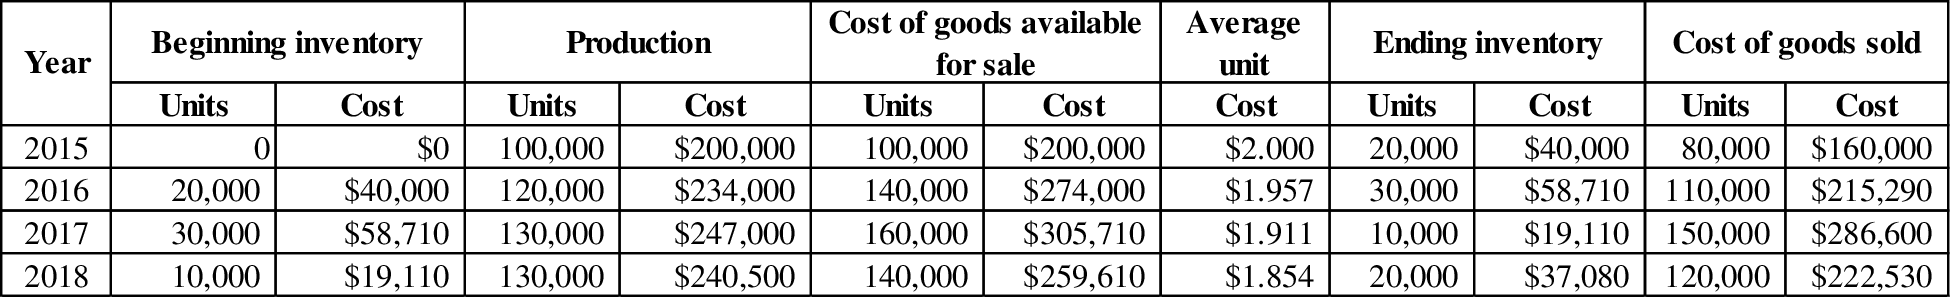
Table (8)
2.
Discuss the reasons whether the company’s return on assets would be higher under FIFO or LIFO.
2.
Explanation of Solution
In FIFO method, net income and total assets are higher than in LIFO (assuming rising costs). But, the net income is different by the annual difference between the two methods, while assets are different by the lifetime difference. Since, the LIFO denominator would be reduced by a larger amount than LIFO numerator, the ratio would be higher under LIFO method.
Want to see more full solutions like this?
Chapter 7 Solutions
Intermediate Accounting: Reporting and Analysis (Looseleaf)


 Intermediate Accounting: Reporting And AnalysisAccountingISBN:9781337788281Author:James M. Wahlen, Jefferson P. Jones, Donald PagachPublisher:Cengage Learning
 Financial Accounting: The Impact on Decision Make...AccountingISBN:9781305654174Author:Gary A. Porter, Curtis L. NortonPublisher:Cengage Learning
 Cornerstones of Financial AccountingAccountingISBN:9781337690881Author:Jay Rich, Jeff JonesPublisher:Cengage Learning
 Individual Income TaxesAccountingISBN:9780357109731Author:HoffmanPublisher:CENGAGE LEARNING - CONSIGNMENT