
Concept explainers
Videos
BIO Microraptor gui: The Biplane Dinosaur
The evolution of flight is a subject of intense interest in paleontology. Some subscribe to the “cursorial” (or ground-up) hypothesis, in which flight began with ground-dwelling animals running and jumping after prey Others favor the “arboreal” (or trees-down) hypothesis, in which tree-dwelling animals, like modern-day flying squirrels, developed flight as an extension of gliding from tree to tree.
A recently discovered fossil from the Cretaceous period in China supports the arboreal hypothesis and adds a new element—it suggests that feathers on both the wings and the lower legs and feet allowed this dinosaur, Microraptor gui, to glide much like a biplane, as shown in Figure 7-31 (a). Researchers have produced a detailed computer simulation of Microraptor, and with its help have obtained the power-versus-speed plot presented in Figure 7-31 (b). This curve shows how much power is required for flight at speeds between 0 and 30 m/s. Notice that the power increases at high speeds, as expected, but it is also high for low speeds, where the dinosaur is almost hovering. A minimum of 8.1 W is needed for flight at 10 m/s. The lower horizontal line shows the estimated 9.8-W power output of Microraptor, indicating the small range of speeds for which flight would be possible. The upper horizontal line shows the wider range of flight speeds that would be available if Microraptor were able to produce 20 W of power.
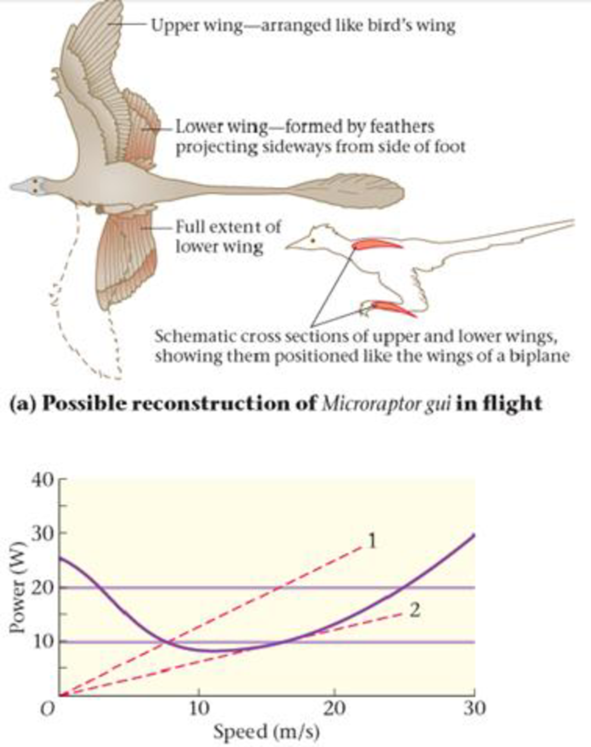
Also of interest are the two dashed, straight lines labeled 1 and 2. These lines represent constant ratios of power to speed—that is, a constant value for P/U Referring to Equation 7-13, we see that
P/v = Fv/v = F
, so lines 1 and 2 correspond to lines of constant force. Line 2 is interesting in that it has the smallest slope that still touches the power-versus-speed curve.
86. How much energy would Microraptor have to expend to fly with a speed of 10 m/s for 1.0 minute?
- A. A 8.1 J
- B. B. 81 J
- C. C. 490 J
- D. D. 600 J
Want to see the full answer?
Check out a sample textbook solution
Chapter 7 Solutions
EP PHYSICS -MOD.MASTERING (18W)
Additional Science Textbook Solutions
Chemistry: Structure and Properties (2nd Edition)
Campbell Biology in Focus (2nd Edition)
Applications and Investigations in Earth Science (9th Edition)
Campbell Essential Biology (7th Edition)
Microbiology with Diseases by Body System (5th Edition)
Campbell Biology (11th Edition)


- A circular coil with 100 turns and a radius of 0.05 m is placed in a magnetic field that changes at auniform rate from 0.2 T to 0.8 T in 0.1 seconds. The plane of the coil is perpendicular to the field.• Calculate the induced electric field in the coil.• Calculate the current density in the coil given its conductivity σ.arrow_forwardAn L-C circuit has an inductance of 0.410 H and a capacitance of 0.250 nF . During the current oscillations, the maximum current in the inductor is 1.80 A . What is the maximum energy Emax stored in the capacitor at any time during the current oscillations? How many times per second does the capacitor contain the amount of energy found in part A? Please show all steps.arrow_forwardA long, straight wire carries a current of 10 A along what we’ll define to the be x-axis. A square loopin the x-y plane with side length 0.1 m is placed near the wire such that its closest side is parallel tothe wire and 0.05 m away.• Calculate the magnetic flux through the loop using Ampere’s law.arrow_forward
- Describe the motion of a charged particle entering a uniform magnetic field at an angle to the fieldlines. Include a diagram showing the velocity vector, magnetic field lines, and the path of the particle.arrow_forwardDiscuss the differences between the Biot-Savart law and Coulomb’s law in terms of their applicationsand the physical quantities they describe.arrow_forwardExplain why Ampere’s law can be used to find the magnetic field inside a solenoid but not outside.arrow_forward
- 3. An Atwood machine consists of two masses, mA and m B, which are connected by an inelastic cord of negligible mass that passes over a pulley. If the pulley has radius RO and moment of inertia I about its axle, determine the acceleration of the masses mA and m B, and compare to the situation where the moment of inertia of the pulley is ignored. Ignore friction at the axle O. Use angular momentum and torque in this solutionarrow_forwardA 0.850-m-long metal bar is pulled to the right at a steady 5.0 m/s perpendicular to a uniform, 0.650-T magnetic field. The bar rides on parallel metal rails connected through a 25-Ω, resistor (Figure 1), so the apparatus makes a complete circuit. Ignore the resistance of the bar and the rails. Please explain how to find the direction of the induced current.arrow_forwardFor each of the actions depicted, determine the direction (right, left, or zero) of the current induced to flow through the resistor in the circuit containing the secondary coil. The coils are wrapped around a plastic core. Immediately after the switch is closed, as shown in the figure, (Figure 1) in which direction does the current flow through the resistor? If the switch is then opened, as shown in the figure, in which direction does the current flow through the resistor? I have the answers to the question, but would like to understand the logic behind the answers. Please show steps.arrow_forward
- When violet light of wavelength 415 nm falls on a single slit, it creates a central diffraction peak that is 8.60 cm wide on a screen that is 2.80 m away. Part A How wide is the slit? ΟΙ ΑΣΦ ? D= 2.7.10-8 Submit Previous Answers Request Answer × Incorrect; Try Again; 8 attempts remaining marrow_forwardTwo complex values are z1=8 + 8i, z2=15 + 7 i. z1∗ and z2∗ are the complex conjugate values. Any complex value can be expessed in the form of a+bi=reiθ. Find θ for (z1-z∗2)/z1+z2∗. Find r and θ for (z1−z2∗)z1z2∗ Please show all stepsarrow_forwardCalculate the center of mass of the hollow cone shown below. Clearly specify the origin and the coordinate system you are using. Z r Y h Xarrow_forward

 Principles of Physics: A Calculus-Based TextPhysicsISBN:9781133104261Author:Raymond A. Serway, John W. JewettPublisher:Cengage Learning
 Physics for Scientists and Engineers: Foundations...PhysicsISBN:9781133939146Author:Katz, Debora M.Publisher:Cengage Learning
 Glencoe Physics: Principles and Problems, Student...PhysicsISBN:9780078807213Author:Paul W. ZitzewitzPublisher:Glencoe/McGraw-Hill
 College PhysicsPhysicsISBN:9781285737027Author:Raymond A. Serway, Chris VuillePublisher:Cengage Learning
 University Physics Volume 1PhysicsISBN:9781938168277Author:William Moebs, Samuel J. Ling, Jeff SannyPublisher:OpenStax - Rice University