
Videos
a.
Find the
a.
Answer to Problem 56CE
The probability that fewer than five employees steal is 0.0262.
Explanation of Solution
In order to qualify as a binomial problem, it must satisfy the following conditions.
- There are only two mutually exclusive outcomes, employees steal from their company and employees do not steal from their company.
- The number of trials is fixed, that is 50 people.
- The probability is constant for each trial, which is 0.20.
- The trials are independent of each other.
Thus, the problem satisfies all the conditions of a binomial distribution.
The mean can be obtained as follows:
The expected number of employees who steal is 10.
The standard deviation can be obtained as follows:
The standard deviation of number of employees who steal is 2.83.
The conditions for normal approximation to the binomial distribution are checked below:
The number of employees
Condition 1:
The condition 1 is satisfied.
Condition 2:
The condition 2 is satisfied.
The conditions 1 and 2 for normal approximation to the binomial distribution are satisfied.
Let the random variable X be the number of employees who steal from their company follows normal distribution with population mean
The probability that fewer than five employees steal can be obtained as follows:
Step-by-step procedure to obtain probability of Z less than –1.94 using Excel:
- Click on the Formulas tab in the top menu.
- Select Insert function. Then from category box, select Statistical and below that NORM.S.DIST.
- Click OK.
- In the dialog box, Enter Z value as –1.94.
- Enter Cumulative as TRUE.
- Click OK, the answer appears in Spreadsheet.
The output obtained using Excel is represented as follows:
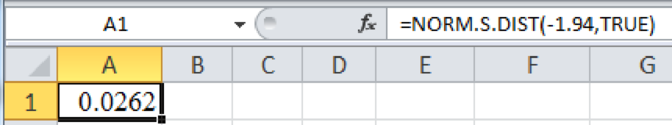
From the above output, the probability of Z less than –1.94 is 0.0262.
Now consider the following:
Therefore, the probability that fewer than five employees steal is 0.0262.
b.
Find the probability that more than five employees steal.
b.
Answer to Problem 56CE
The probability that more than five employees steal is 0.9441.
Explanation of Solution
The population mean
The probability that more than five employees steal can be obtained as follows:
Step-by-step procedure to obtain probability of Z less than –1.59 using Excel:
- Click on the Formulas tab in the top menu.
- Select Insert
function . Then from category box, select Statistical and below that NORM.S.DIST. - Click OK.
- In the dialog box, Enter Z value as –1.59.
- Enter Cumulative as TRUE.
- Click OK, the answer appears in Spreadsheet.
The output obtained using Excel is represented as follows:
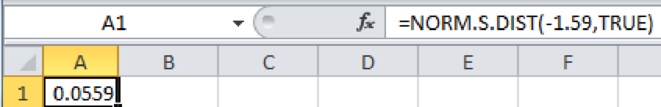
From the above output, the probability of Z less than –1.59 is 0.0559.
Now consider the following:
Therefore, the probability that more than five employees steal is 0.9441.
c.
Find the probability that exactly five employees steal.
c.
Answer to Problem 56CE
The probability that exactly five employees steal is 0.0297.
Explanation of Solution
The probability that exactly five employees steal can be obtained as follows:
From the part (a), the probability of Z less than –1.94 is 0.0262.
From the part (b), the probability of Z less than –1.59 is 0.0559.
Now consider,
Therefore, the probability that exactly five employees steal is 0.0297.
d.
Find the probability that more than 5 but fewer than 15 employees steal.
d.
Answer to Problem 56CE
The probability that more than 5 but fewer than 15 employees steal is 0.8882.
Explanation of Solution
The probability that more than 5 but fewer than 15 employees steal can be obtained as follows:
From the part (b), the probability of Z less than –1.59 is 0.0559.
Step-by-step procedure to obtain probability of Z less than 1.59 using Excel:
- Click on the Formulas tab in the top menu.
- Select Insert function. Then from category box, select Statistical and below that NORM.S.DIST.
- Click OK.
- In the dialog box, Enter Z value as 1.59.
- Enter Cumulative as TRUE.
- Click OK, the answer appears in Spreadsheet.
The output obtained using Excel is represented as follows:
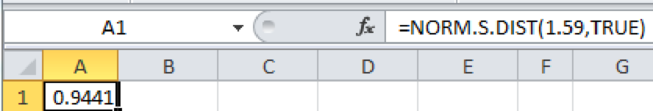
From the above output, the probability of Z less than 1.59 is 0.9441.
Now consider,
Therefore, the probability that more than 5 but fewer than 15 employees steal is 0.8882.
Want to see more full solutions like this?
Chapter 7 Solutions
Gen Combo Ll Statistical Techniques In Business And Economics; Connect Ac


- Harvard University California Institute of Technology Massachusetts Institute of Technology Stanford University Princeton University University of Cambridge University of Oxford University of California, Berkeley Imperial College London Yale University University of California, Los Angeles University of Chicago Johns Hopkins University Cornell University ETH Zurich University of Michigan University of Toronto Columbia University University of Pennsylvania Carnegie Mellon University University of Hong Kong University College London University of Washington Duke University Northwestern University University of Tokyo Georgia Institute of Technology Pohang University of Science and Technology University of California, Santa Barbara University of British Columbia University of North Carolina at Chapel Hill University of California, San Diego University of Illinois at Urbana-Champaign National University of Singapore McGill…arrow_forwardName Harvard University California Institute of Technology Massachusetts Institute of Technology Stanford University Princeton University University of Cambridge University of Oxford University of California, Berkeley Imperial College London Yale University University of California, Los Angeles University of Chicago Johns Hopkins University Cornell University ETH Zurich University of Michigan University of Toronto Columbia University University of Pennsylvania Carnegie Mellon University University of Hong Kong University College London University of Washington Duke University Northwestern University University of Tokyo Georgia Institute of Technology Pohang University of Science and Technology University of California, Santa Barbara University of British Columbia University of North Carolina at Chapel Hill University of California, San Diego University of Illinois at Urbana-Champaign National University of Singapore…arrow_forwardA company found that the daily sales revenue of its flagship product follows a normal distribution with a mean of $4500 and a standard deviation of $450. The company defines a "high-sales day" that is, any day with sales exceeding $4800. please provide a step by step on how to get the answers in excel Q: What percentage of days can the company expect to have "high-sales days" or sales greater than $4800? Q: What is the sales revenue threshold for the bottom 10% of days? (please note that 10% refers to the probability/area under bell curve towards the lower tail of bell curve) Provide answers in the yellow cellsarrow_forward
- Find the critical value for a left-tailed test using the F distribution with a 0.025, degrees of freedom in the numerator=12, and degrees of freedom in the denominator = 50. A portion of the table of critical values of the F-distribution is provided. Click the icon to view the partial table of critical values of the F-distribution. What is the critical value? (Round to two decimal places as needed.)arrow_forwardA retail store manager claims that the average daily sales of the store are $1,500. You aim to test whether the actual average daily sales differ significantly from this claimed value. You can provide your answer by inserting a text box and the answer must include: Null hypothesis, Alternative hypothesis, Show answer (output table/summary table), and Conclusion based on the P value. Showing the calculation is a must. If calculation is missing,so please provide a step by step on the answers Numerical answers in the yellow cellsarrow_forwardShow all workarrow_forward
 Holt Mcdougal Larson Pre-algebra: Student Edition...AlgebraISBN:9780547587776Author:HOLT MCDOUGALPublisher:HOLT MCDOUGAL
 College AlgebraAlgebraISBN:9781305115545Author:James Stewart, Lothar Redlin, Saleem WatsonPublisher:Cengage Learning
 Algebra and Trigonometry (MindTap Course List)AlgebraISBN:9781305071742Author:James Stewart, Lothar Redlin, Saleem WatsonPublisher:Cengage Learning