
Concept explainers
Videos
Suppose a new test is proposed to identify patients with a specific condition.
One specimen is obtained from each of 220 subjects in the population to whom the test will be applied. Fifty-one (51) subjects have the condition and 169 do not, according to a gold standard used to assess the presence of the condition (referred to as a reference standard below). The following results are obtained:
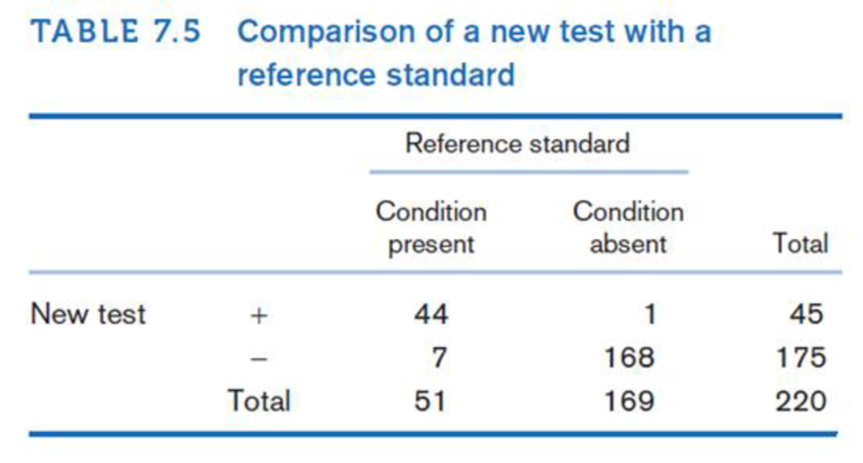
Suppose a quality score is constructed for the test. A true positive identified by the test is given a score of +20. A
true negative identified by the test is given a score of +10. A false positive identified by the test is given a score of -5. A false negative identified by the test is given a score of-20.
The FDA will approve the new test if the lower bound of a 90% Cl for the
Hint: Assume that the score distribution is approximately normal or that the central limit theorem is applicable.
Hint: Assume that a t distribution with > 200 df is approximately normal.
Hint: To compute the mean and variance from grouped data, use the formulas
where xi is the ith score value, fi is the frequency of the ith score value, k = number of score values, and
Want to see the full answer?
Check out a sample textbook solution
Chapter 7 Solutions
Fundamentals of Biostatistics


- A marketing agency wants to determine whether different advertising platforms generate significantly different levels of customer engagement. The agency measures the average number of daily clicks on ads for three platforms: Social Media, Search Engines, and Email Campaigns. The agency collects data on daily clicks for each platform over a 10-day period and wants to test whether there is a statistically significant difference in the mean number of daily clicks among these platforms. Conduct ANOVA test. You can provide your answer by inserting a text box and the answer must include: also please provide a step by on getting the answers in excel Null hypothesis, Alternative hypothesis, Show answer (output table/summary table), and Conclusion based on the P value.arrow_forwardA company found that the daily sales revenue of its flagship product follows a normal distribution with a mean of $4500 and a standard deviation of $450. The company defines a "high-sales day" that is, any day with sales exceeding $4800. please provide a step by step on how to get the answers Q: What percentage of days can the company expect to have "high-sales days" or sales greater than $4800? Q: What is the sales revenue threshold for the bottom 10% of days? (please note that 10% refers to the probability/area under bell curve towards the lower tail of bell curve) Provide answers in the yellow cellsarrow_forwardBusiness Discussarrow_forward
- The following data represent total ventilation measured in liters of air per minute per square meter of body area for two independent (and randomly chosen) samples. Analyze these data using the appropriate non-parametric hypothesis testarrow_forwardeach column represents before & after measurements on the same individual. Analyze with the appropriate non-parametric hypothesis test for a paired design.arrow_forwardShould you be confident in applying your regression equation to estimate the heart rate of a python at 35°C? Why or why not?arrow_forward
 Glencoe Algebra 1, Student Edition, 9780079039897...AlgebraISBN:9780079039897Author:CarterPublisher:McGraw Hill
 College Algebra (MindTap Course List)AlgebraISBN:9781305652231Author:R. David Gustafson, Jeff HughesPublisher:Cengage Learning
 Holt Mcdougal Larson Pre-algebra: Student Edition...AlgebraISBN:9780547587776Author:HOLT MCDOUGALPublisher:HOLT MCDOUGAL