a)
The question requires us to draw a graph representing a fall in the
a)
Explanation of Solution
A simultaneous increase in supply and a decrease in
The following graph represents the situation where quantity falls due to the simultaneous change in demand and supply:
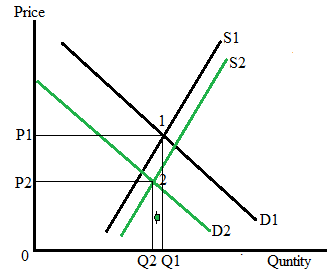
Here, an increase in supply shifts the supply curve to the right from S1 to S2, and a fall in demand shifts the demand curve to the left from D1 to D2. As a result, both the equilibrium price and the equilibrium quantity will fall.
The equilibrium quantity will fall because the change in demand is more than the change in supply as shown in the above figure.
Therefore, in the above situation, a simultaneous increase in supply and a fall in demand will:
- Decrease the price
- Decrease the quantity
The following table represents the changes in equilibrium quantity and equilibrium price when demand and supply change:
| Factors | Equilibrium quantity | Equilibrium price |
| Increase in demand | Increase | Increase |
| Decrease in demand | Decrease | Decrease |
| Increase in supply | Increase | Decrease |
| Decrease in supply | Decrease | Increase |
b)
The question requires us to draw a graph representing an increase in the equilibrium quantity, and determine the impact on the equilibrium price.
b)
Explanation of Solution
The following graph represents the situation where quantity increases due to the simultaneous change in demand and supply:
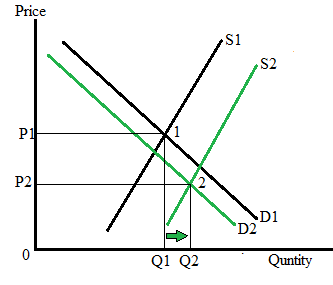
Here, an increase in supply shifts the supply curve to the right from S1 to S2, and a fall in demand shifts the demand curve to the left from D1 to D2. As the result, the equilibrium price will fall, and the equilibrium quantity will increase.
The equilibrium quantity increases because the change in demand is less than the change in supply as shown in the above figure.
Therefore, in the above situation, a simultaneous increase in supply and a fall in demand will:
- Decrease the price
- Increase the quantity
Chapter 7 Solutions
EBK KRUGMAN'S ECONOMICS F/AP COURSE

- Imagine you are a world leader and you just viewed this presentation as part of the United Nations Sustainable Development Goal Meeting. Summarize your findings https://www.youtube.com/watch?v=v7WUpgPZzpIarrow_forwardPlease draw a standard Commercial Bank Balance Sheet and briefly explain each of the main components.arrow_forwardPlease draw the Federal Reserve System’s Balance Sheet and briefly explain each of the main components.arrow_forward
- 19. In a paragraph, no bullet, points please answer the question and follow the instructions. Give only the solution: Use the Feynman technique throughout. Assume that you’re explaining the answer to someone who doesn’t know the topic at all. How does the Federal Reserve currently get the federal funds rate where they want it to be?arrow_forward18. In a paragraph, no bullet, points please answer the question and follow the instructions. Give only the solution: Use the Feynman technique throughout. Assume that you’re explaining the answer to someone who doesn’t know the topic at all. Carefully compare and contrast fiscal policy and monetary policy.arrow_forward15. In a paragraph, no bullet, points please answer the question and follow the instructions. Give only the solution: Use the Feynman technique throughout. Assume that you’re explaining the answer to someone who doesn’t know the topic at all. What are the common arguments for and against high levels of federal debt?arrow_forward
- 17. In a paragraph, no bullet, points please answer the question and follow the instructions. Give only the solution: Use the Feynman technique throughout. Assume that you’re explaining the answer to someone who doesn’t know the topic at all. Explain the difference between present value and future value. Be sure to use and explain the mathematical formulas for both. How does one interpret these formulas?arrow_forward12. Give the solution: Use the Feynman technique throughout. Assume that you’re explaining the answer to someone who doesn’t know the topic at all. Show and carefully explain the Taylor rule and all of its components, used as a monetary policy guide.arrow_forward20. In a paragraph, no bullet, points please answer the question and follow the instructions. Give only the solution: Use the Feynman technique throughout. Assume that you’re explaining the answer to someone who doesn’t know the topic at all. What is meant by the Federal Reserve’s new term “ample reserves”? What may be hidden in this new formulation by the Fed?arrow_forward
- 14. In a paragraph, no bullet, points please answer the question and follow the instructions. Give only the solution: Use the Feynman technique throughout. Assume that you’re explaining the answer to someone who doesn’t know the topic at all. What is the Keynesian view of fiscal policy and why are some economists skeptical?arrow_forward16. In a paragraph, no bullet, points please answer the question and follow the instructions. Give only the solution: Use the Feynman technique throughout. Assume that you’re explaining the answer to someone who doesn’t know the topic at all. Describe a bond or Treasury security. What are its components and what do they mean?arrow_forward13. In a paragraph, no bullet, points please answer the question and follow the instructions. Give only the solution: Use the Feynman technique throughout. Assume that you’re explaining the answer to someone who doesn’t know the topic at all. Where does the government get its funds that it spends? What is the difference between federal debt and federal deficit?arrow_forward

 Principles of Economics (12th Edition)EconomicsISBN:9780134078779Author:Karl E. Case, Ray C. Fair, Sharon E. OsterPublisher:PEARSON
 Engineering Economy (17th Edition)EconomicsISBN:9780134870069Author:William G. Sullivan, Elin M. Wicks, C. Patrick KoellingPublisher:PEARSON
 Principles of Economics (MindTap Course List)EconomicsISBN:9781305585126Author:N. Gregory MankiwPublisher:Cengage Learning
 Managerial Economics: A Problem Solving ApproachEconomicsISBN:9781337106665Author:Luke M. Froeb, Brian T. McCann, Michael R. Ward, Mike ShorPublisher:Cengage Learning
 Managerial Economics & Business Strategy (Mcgraw-...EconomicsISBN:9781259290619Author:Michael Baye, Jeff PrincePublisher:McGraw-Hill Education