
EP INTRODUCTORY STATISTICS-MYSTATLAB
3rd Edition
ISBN: 9780135190210
Author: Gould
Publisher: PEARSON CO
expand_more
expand_more
format_list_bulleted
Concept explainers
Videos
Textbook Question
Chapter 7, Problem 37SE
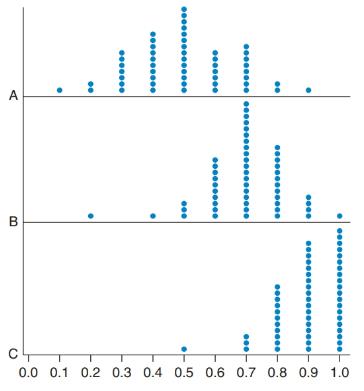
Fair Coin? One of the graphs shows the proportion of heads from flipping a fair coin 10 times, repeatedly. The others do not. Which graph represents the coin flips? Explain how you know.
Expert Solution & Answer
Want to see the full answer?
Check out a sample textbook solution
Students have asked these similar questions
A special interest group reports a tiny margin of error (plus or minus 0.04 percent) for its online survey based on 50,000 responses. Is the margin of error legitimate? (Assume that the group’s math is correct.)
Suppose that 73 percent of a sample of 1,000 U.S. college students drive a used car as opposed to a new car or no car at all.
Find an 80 percent confidence interval for the percentage of all U.S. college students who drive a used car.What sample size would cut this margin of error in half?
You want to compare the average number of tines on the antlers of male deer in two nearby metro parks. A sample of 30 deer from the first park shows an average of 5 tines with a population standard deviation of 3. A sample of 35 deer from the second park shows an average of 6 tines with a population standard deviation of 3.2.
Find a 95 percent confidence interval for the difference in average number of tines for all male deer in the two metro parks (second park minus first park).Do the parks’ deer populations differ in average size of deer antlers?
Chapter 7 Solutions
EP INTRODUCTORY STATISTICS-MYSTATLAB
Ch. 7 - Population vs. Sample (Example 1) In 2017 the...Ch. 7 - Population vs. Sample In 2017 Pew Research Center...Ch. 7 - Parameter vs. Statistic (Example 2) Bob Ross...Ch. 7 - Parameter vs. Statistic The website...Ch. 7 - x vs. Two symbols are used for the mean: and x....Ch. 7 - vs. s Two symbols are used for the standard...Ch. 7 - vs. x The mean weight of all professional NBA...Ch. 7 - vs. s The standard deviation of all professional...Ch. 7 - Notation (Example 3) The city of San Francisco...Ch. 7 - Notation The city of Chicago provides an open data...
Ch. 7 - Samples and Populations (Example 4) Chapman...Ch. 7 - Samples and Populations The Centers for Disease...Ch. 7 - Sample vs. Census You are receiving a large...Ch. 7 - Sampling GPAs Suppose you want to estimate the...Ch. 7 - Sampling with and without Replacement Explain the...Ch. 7 - Simple Random Sampling Is simple random sampling...Ch. 7 - Finding a Random Sample (Example 5) You need to...Ch. 7 - Finding a Random Sample You need to select a...Ch. 7 - Random Sampling Assume your class has 30 students...Ch. 7 - Random Sampling with Coins Assume your class has...Ch. 7 - Survey Response (Example 6) A school district...Ch. 7 - Survey Response To determine if patrons are...Ch. 7 - Views on Capital Punishment In carrying out a...Ch. 7 - Views on Capital Punishment Use the data given in...Ch. 7 - Targets: Bias or Lack of Precision? a. If a...Ch. 7 - Targets: Bias or Lack of Precision, Again a. If a...Ch. 7 - Bias? Suppose that, when taking a random sample of...Ch. 7 - Unbiased Sample? Suppose you attend a school that...Ch. 7 - Proportion of Odd Digits A large collection of...Ch. 7 - Proportion of Odd Digits...Ch. 7 - Prob. 31SECh. 7 - Prob. 32SECh. 7 - ESP A Zener deck of cards has cards that show one...Ch. 7 - ESP Again In the graphs for Exercise 7.33, explain...Ch. 7 - Standard Error Which of the dotplots given in...Ch. 7 - Bias? Assuming that the true proportion of success...Ch. 7 - Fair Coin? One of the graphs shows the proportion...Ch. 7 - Far from Fair Which of the graphs in Exercise 7.37...Ch. 7 - Variation in Sample Proportions (Example 7)...Ch. 7 - Variation in Sample Proportions Suppose it is...Ch. 7 - Driver’s License (Example 8) According to a 2017...Ch. 7 - BA Attainment According to a 2017 Pew Research...Ch. 7 - Stress (Example 9) According to a 2017 Gallup...Ch. 7 - Prob. 44SECh. 7 - Streaming Services (Example 10) According to a...Ch. 7 - Prob. 46SECh. 7 - Voting According to a 2017 Pew Research Center...Ch. 7 - Instagram According to a 2018 Pew Research Center...Ch. 7 - Super Bowl In 2018 it was estimated that...Ch. 7 - College Enrollment According to data released in...Ch. 7 - Color Blindness While the majority of people who...Ch. 7 - Blood Type Human blood is divided into 8 possible...Ch. 7 - Prob. 53SECh. 7 - Environment A 2017 Gallup poll found that 601 out...Ch. 7 - Gun Control According to a 2017 Gallup Poll, 617...Ch. 7 - Smokers According to a 2017 Gallup poll, 572 out...Ch. 7 - Voting A random sample of likely voters showed...Ch. 7 - Voting A random sample of likely voters showed...Ch. 7 - Prob. 59SECh. 7 - Diabetes In a simple random sample of 1200...Ch. 7 - Marijuana Legalization A 2017 Gallup poll reported...Ch. 7 - Organic Produce A 2016 Pew Research poll found...Ch. 7 - Democracy and Unpopular Views A 2017 survey of...Ch. 7 - Democracy and Free Press A 2017 survey of U.S....Ch. 7 - Winter Olympics (Example 12) According to a 2018...Ch. 7 - Marijuana Use The Gallup poll reported that 45 of...Ch. 7 - Past Presidential Vote In the 1960 presidential...Ch. 7 - Batting Averages The website www.mlb.com compiles...Ch. 7 - Picky Eaters (Example 13) In a 2017 Harris poll...Ch. 7 - Nutrition Labels Of 1019 U.S. adults responding to...Ch. 7 - Prob. 71SECh. 7 - Estimating Sample Size In the 2018 study Closing...Ch. 7 - Happiness A Harris poll asked Americans in 2016...Ch. 7 - Artificial Intelligence A Harris poll asked a...Ch. 7 - Democratic (Examples 15, 16, 17, 18) Voters and...Ch. 7 - Trust in Judiciary In 2016 and 2017 Gallup asked...Ch. 7 - Perry Preschool and Graduation from High School...Ch. 7 - Preschool: Just the Boys Refer to Exercise 7.77...Ch. 7 - Prob. 79SECh. 7 - Sugar-Sweetened Beverages In 2017, the journal...Ch. 7 - Gender and Use of Turn Signals Statistics student...Ch. 7 - Local TV News Pew Research reported that 46 of...Ch. 7 - Drug for Nausea Ondansetron (Zofran) is a drug...Ch. 7 - Preschool: Just the Girls The Perry Preschool...Ch. 7 - Prob. 85CRECh. 7 - College Enrollment (Women) According to the Bureau...Ch. 7 - Prob. 87CRECh. 7 - Technology Anxiety In a 2018 survey conducted by...Ch. 7 - Sample Proportion A poll on a proposition showed...Ch. 7 - Sample Proportion A poll on a proposition showed...Ch. 7 - Margin of Error A poll on a proposition showed...Ch. 7 - Margin of Error A poll on a proposition showed...Ch. 7 - Dreaming in Color According to studies done in the...Ch. 7 - Hand Washing Ignaz Semmelweiss (1818-1865) was the...Ch. 7 - Prob. 95CRECh. 7 - School Bond Suppose a political consultant is...Ch. 7 - Prob. 97CRECh. 7 - Prob. 98CRECh. 7 - Voters Poll: Sample Size A polling agency wants to...Ch. 7 - Ratio of Sample Sizes Find the sample size...Ch. 7 - Criticize the Sampling Marco is interested in...Ch. 7 - Criticize the Sampling Maria opposes capital...Ch. 7 - Random Sampling? If you walked around your school...Ch. 7 - Biased Sample? You want to find the mean weight of...Ch. 7 - Bias? Suppose that, when taking a random sample of...Ch. 7 - Bias? Four women selected from a photo of 123 were...Ch. 7 - Sample Size Formula (Part 1) From Formula 7.2, an...Ch. 7 - Sample Size Formula (Part 2) Using your result...
Additional Math Textbook Solutions
Find more solutions based on key concepts
(a) Make a stem-and-leaf plot for these 24 observations on the number of customers who used a down-town CitiBan...
APPLIED STAT.IN BUS.+ECONOMICS
First Derivative Test a. Locale the critical points of f. b. Use the First Derivative Test to locale the local ...
Calculus: Early Transcendentals (2nd Edition)
For Problems 23-28, write in simpler form, as in Example 4. logbFG
Finite Mathematics for Business, Economics, Life Sciences and Social Sciences
1. How is a sample related to a population?
Elementary Statistics: Picturing the World (7th Edition)
Knowledge Booster


Learn more about
Need a deep-dive on the concept behind this application? Look no further. Learn more about this topic, statistics and related others by exploring similar questions and additional content below.Similar questions
- Suppose that you want to increase the confidence level of a particular confidence interval from 80 percent to 95 percent without changing the width of the confidence interval. Can you do it?arrow_forwardA random sample of 1,117 U.S. college students finds that 729 go home at least once each term. Find a 98 percent confidence interval for the proportion of all U.S. college students who go home at least once each term.arrow_forwardSuppose that you make two confidence intervals with the same data set — one with a 95 percent confidence level and the other with a 99.7 percent confidence level. Which interval is wider?Is a wide confidence interval a good thing?arrow_forward
- Is it true that a 95 percent confidence interval means you’re 95 percent confident that the sample statistic is in the interval?arrow_forwardTines can range from 2 to upwards of 50 or more on a male deer. You want to estimate the average number of tines on the antlers of male deer in a nearby metro park. A sample of 30 deer has an average of 5 tines, with a population standard deviation of 3. Find a 95 percent confidence interval for the average number of tines for all male deer in this metro park.Find a 98 percent confidence interval for the average number of tines for all male deer in this metro park.arrow_forwardBased on a sample of 100 participants, the average weight loss the first month under a new (competing) weight-loss plan is 11.4 pounds with a population standard deviation of 5.1 pounds. The average weight loss for the first month for 100 people on the old (standard) weight-loss plan is 12.8 pounds, with population standard deviation of 4.8 pounds. Find a 90 percent confidence interval for the difference in weight loss for the two plans( old minus new) Whats the margin of error for your calculated confidence interval?arrow_forward
- A 95 percent confidence interval for the average miles per gallon for all cars of a certain type is 32.1, plus or minus 1.8. The interval is based on a sample of 40 randomly selected cars. What units represent the margin of error?Suppose that you want to decrease the margin of error, but you want to keep 95 percent confidence. What should you do?arrow_forward3. (i) Below is the R code for performing a X2 test on a 2×3 matrix of categorical variables called TestMatrix: chisq.test(Test Matrix) (a) Assuming we have a significant result for this procedure, provide the R code (including any required packages) for an appropriate post hoc test. (b) If we were to apply this technique to a 2 × 2 case, how would we adapt the code in order to perform the correct test? (ii) What procedure can we use if we want to test for association when we have ordinal variables? What code do we use in R to do this? What package does this command belong to? (iii) The following code contains the initial steps for a scenario where we are looking to investigate the relationship between age and whether someone owns a car by using frequencies. There are two issues with the code - please state these. Row3<-c(75,15) Row4<-c(50,-10) MortgageMatrix<-matrix(c(Row1, Row4), byrow=T, nrow=2, MortgageMatrix dimnames=list(c("Yes", "No"), c("40 or older","<40")))…arrow_forwardDescribe the situation in which Fisher’s exact test would be used?(ii) When do we use Yates’ continuity correction (with respect to contingencytables)?[2 Marks] 2. Investigate, checking the relevant assumptions, whether there is an associationbetween age group and home ownership based on the sample dataset for atown below:Home Owner: Yes NoUnder 40 39 12140 and over 181 59Calculate and evaluate the effect size.arrow_forward
arrow_back_ios
SEE MORE QUESTIONS
arrow_forward_ios
Recommended textbooks for you
 Glencoe Algebra 1, Student Edition, 9780079039897...AlgebraISBN:9780079039897Author:CarterPublisher:McGraw Hill
 Holt Mcdougal Larson Pre-algebra: Student Edition...AlgebraISBN:9780547587776Author:HOLT MCDOUGALPublisher:HOLT MCDOUGAL
 Big Ideas Math A Bridge To Success Algebra 1: Stu...AlgebraISBN:9781680331141Author:HOUGHTON MIFFLIN HARCOURTPublisher:Houghton Mifflin Harcourt
 Algebra: Structure And Method, Book 1AlgebraISBN:9780395977224Author:Richard G. Brown, Mary P. Dolciani, Robert H. Sorgenfrey, William L. ColePublisher:McDougal Littell

Glencoe Algebra 1, Student Edition, 9780079039897...
Algebra
ISBN:9780079039897
Author:Carter
Publisher:McGraw Hill
Holt Mcdougal Larson Pre-algebra: Student Edition...
Algebra
ISBN:9780547587776
Author:HOLT MCDOUGAL
Publisher:HOLT MCDOUGAL
Big Ideas Math A Bridge To Success Algebra 1: Stu...
Algebra
ISBN:9781680331141
Author:HOUGHTON MIFFLIN HARCOURT
Publisher:Houghton Mifflin Harcourt
Algebra: Structure And Method, Book 1
Algebra
ISBN:9780395977224
Author:Richard G. Brown, Mary P. Dolciani, Robert H. Sorgenfrey, William L. Cole
Publisher:McDougal Littell
Use of ALGEBRA in REAL LIFE; Author: Fast and Easy Maths !;https://www.youtube.com/watch?v=9_PbWFpvkDc;License: Standard YouTube License, CC-BY
Compound Interest Formula Explained, Investment, Monthly & Continuously, Word Problems, Algebra; Author: The Organic Chemistry Tutor;https://www.youtube.com/watch?v=P182Abv3fOk;License: Standard YouTube License, CC-BY
Applications of Algebra (Digit, Age, Work, Clock, Mixture and Rate Problems); Author: EngineerProf PH;https://www.youtube.com/watch?v=Y8aJ_wYCS2g;License: Standard YouTube License, CC-BY