
Concept explainers
Videos
a.
Compute the
a.
Answer to Problem 32E
The mean of the random variable is 22.
The standard deviation of the random variable is 3.146.
Explanation of Solution
The binomial
The mean can be obtained as follows:
Therefore, the mean of the random variable is 12.5.
The standard deviation of the random variable can be obtained as follows:
Thus, the standard deviation of the random variable is 3.146.
b.
Find the probability that X is 25 or greater.
b.
Answer to Problem 32E
The probability that X takes 25 or greater is 0.2148.
Explanation of Solution
The probability that X is 25 or greater can be obtained as follows:
Step-by-step procedure to obtain the probability using MINTAB software:
- Choose Graph > Probability Distribution Plot.
- Select View Probability.
- From Distribution, choose Normal.
- Enter Mean as 0 and Standard deviation as 1.
- Click the Shaded Area tab.
- Define Shaded area by Right tail.
- Enter X value as 0.79.
- Click OK.
Output obtained using MINITAB software is represented as follows:
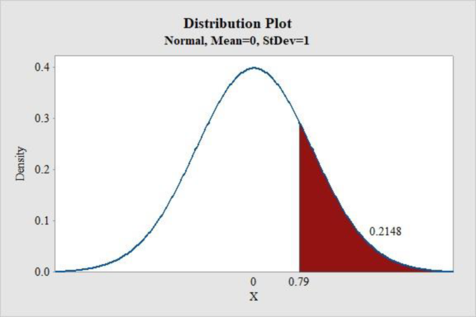
From the above output, the probability that X takes 25 or more is 0.2148.
c.
Find the probability that X is 15 or less.
c.
Answer to Problem 32E
The probability that X takes 15 or less is 0.01970.
Explanation of Solution
The probability that X is 15 or less can be obtained as follows:
Step-by-step procedure to obtain the probability using MINTAB software:
- Choose Graph > Probability Distribution Plot.
- Select View Probability.
- From Distribution, choose Normal.
- Enter Mean as 0 and Standard deviation as 1.
- Click the Shaded Area tab.
- Define Shaded area by Left tail.
- Enter X value as –2.06.
- Click OK.
Output obtained using MINITAB software is represented as follows:
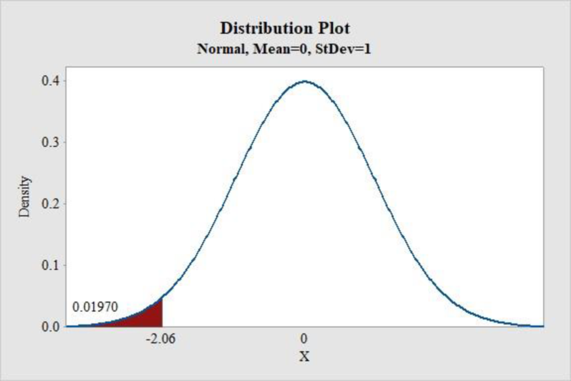
From the above output, the probability that X takes 15 or less is 0.01970.
d.
Find the probability that X is between 15 and 25, inclusive.
d.
Answer to Problem 32E
The probability that X is between 15 and 25 is 0.8578.
Explanation of Solution
The probability that X is between 15 and 25 can be obtained as follows:
Step-by-step procedure to obtain the probability using MINTAB software:
- Choose Graph > Probability Distribution Plot.
- Select View Probability.
- From Distribution, choose Normal.
- Enter Mean as 0 and Standard deviation as 1.
- Click the Shaded Area tab.
- Define Shaded area by Middle.
- Enter X1 value as –2.38.
- Enter X2 value as 1.11.
- Click OK.
Output obtained using MINITAB software is represented as follows:
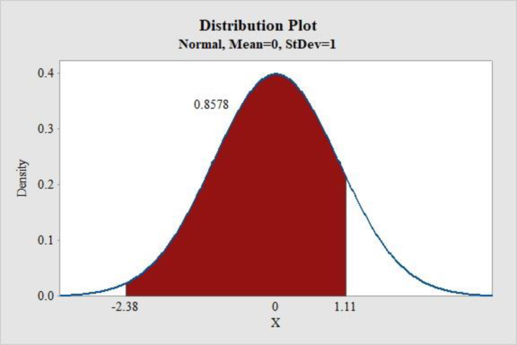
From the above output, the probability that X is between 15 and 25 is 0.8578.
Want to see more full solutions like this?
Chapter 7 Solutions
EBK STATISTICAL TECHNIQUES IN BUSINESS


- 4. Vons, a large supermarket in Grover Beach, California, is con- sidering extending its store hours from 7:00 am to midnight, seven days a week, to 6:00 am to midnight. Discuss the sam- pling bias in the following sampling strategies:arrow_forward3. Natalie Min is an undergraduate in the Haas School of Busi- ness at Berkeley. She wishes to pursue an MBA from Berkeley and wants to know the profile of other students who are likely to apply to the Berkeley MBA program. In particular, she wants to know the GPA of students with whom she might be compet- ing. She randomly surveys 40 students from her accounting class for the analysis. Discuss in detail whether or not Natalie's analysis is based on a representative sample.arrow_forwardSee data attached. SoftBus Company sells PC equipment and customized software to small companies to help them manage their day-to-day business activities. Although SoftBus spends time with all customers to understand their needs, the customers are eventually on their own to use the equipment and software intelligently. To understand its customers better, SoftBus recently sent questionnaires to a large number of prospective customers. Key personnel—those who would be using the software—were asked to fill out the questionnaire. SoftBus received 82 usable responses, as shown in the file. You can assume that these employees represent a random sample of all of SoftBus's prospective customers. SoftBus believes it can afford to spend much less time with customers who own PCs and score at least 4 on PC Knowledge. Let's call these the "PC-savvy" customers. On the other hand, SoftBus believes it will have to spend a lot of time with customers who do not own a PC and score 2 or less on PC…arrow_forward
- See data attached. SoftBus Company sells PC equipment and customized software to small companies to help them manage their day-to-day business activities. Although SoftBus spends time with all customers to understand their needs, the customers are eventually on their own to use the equipment and software intelligently. To understand its customers better, SoftBus recently sent questionnaires to a large number of prospective customers. Key personnel—those who would be using the software—were asked to fill out the questionnaire. SoftBus received 82 usable responses, as shown in the file. You can assume that these employees represent a random sample of all of SoftBus's prospective customers. SoftBus believes it can afford to spend much less time with customers who own PCs and score at least 4 on PC Knowledge. Let's call these the "PC-savvy" customers. On the other hand, SoftBus believes it will have to spend a lot of time with customers who do not own a PC and score 2 or less on PC…arrow_forwardWho is the better student, relative to his or her classmates? Here’s all the information you ever wanted to knowarrow_forward3. A bag of Skittles contains five colors: red, orange, green, yellow, and purple. The probabilities of choosing each color are shown in the chart below. What is the probability of choosing first a red, then a purple, and then a green Skittle, replacing the candies in between picks? Color Probability Red 0.2299 Green 0.1908 Orange 0.2168 Yellow 0.1889 Purple 0.1736arrow_forward
- Name: Quiz A 5.3-5.4 Sex Female Male Total Happy 90 46 136 Healthy 20 13 33 Rich 10 31 41 Famous 0 8 8 Total 120 98 218 Use the following scenario for questions 1 & 2. One question on the Census at School survey asks students if they would prefer to be happy, healthy, rich, or famous. Students may only choose one of these responses. The two-way table summarizes the responses of 218 high school students from the United States by sex. Preferred status 1. Define event F as a female student and event R as rich. a. Find b. Find or c. Find and 2. Define event F as a female student and event R as rich. a. Find b. Find c. Using your results from a and b, are these events (female student and rich) independent? Use the following scenario for questions 3 & 4. At the end of a 5k race, runners are offered a donut or a banana. The event planner examined each runner's race bib and noted whether Age Less than 30 years old At least 30 years old Total Choice Donut Banana 52 54 106 5 72 77 Total 57 126…arrow_forwardI need help with this problem and an explanation of the solution for the image described below. (Statistics: Engineering Probabilities)arrow_forwardI need help with this problem and an explanation of the solution for the image described below. (Statistics: Engineering Probabilities)arrow_forward
- I need help with this problem and an explanation of the solution for the image described below. (Statistics: Engineering Probabilities)arrow_forwardI need help with this problem and an explanation of the solution for the image described below. (Statistics: Engineering Probabilities)arrow_forwardI need help with this problem and an explanation of the solution for the image described below. (Statistics: Engineering Probabilities)arrow_forward
 Glencoe Algebra 1, Student Edition, 9780079039897...AlgebraISBN:9780079039897Author:CarterPublisher:McGraw Hill
 Holt Mcdougal Larson Pre-algebra: Student Edition...AlgebraISBN:9780547587776Author:HOLT MCDOUGALPublisher:HOLT MCDOUGAL