Concept explainers
In this problem we have to get the data from yahoo finance for Alcoa and S&P 500 for 60 months and calculate their returns by using this formula:
Returns = ln(Return in current year/return in previous year)
Here ln stands for natural logarithm.
Explanation of Solution
The data is shown below:
| Date | Returns Alcoa | Returns S&P |
| 12/1/2013 | 0 | 0 |
| 1/1/2014 | 0 | 0 |
| 2/1/2014 | 0.019785587 | 0.042213375 |
| 3/1/2014 | 0.094520691 | 0.006908249 |
| 4/1/2014 | 0.045565745 | 0.006181643 |
| 5/1/2014 | 0.010340052 | 0.020812196 |
| 6/1/2014 | 0.09213958 | 0.018878997 |
| 7/1/2014 | 0.09598186 | -0.015194687 |
| 8/1/2014 | 0.013333413 | 0.036963644 |
| 9/1/2014 | -0.029980428 | -0.015635436 |
| 10/1/2014 | 0.040797065 | 0.022936399 |
| 11/1/2014 | 0.031133233 | 0.024237474 |
| 12/1/2014 | -0.088938172 | -0.004197385 |
| 1/1/2015 | -0.008906032 | -0.031532779 |
| 2/1/2015 | -0.056519624 | 0.053438876 |
| 3/1/2015 | -0.133367024 | -0.017549197 |
| 4/1/2015 | 0.037969704 | 0.008484722 |
| 5/1/2015 | -0.071017427 | 0.01043673 |
| 6/1/2015 | -0.112097041 | -0.021235559 |
| 7/1/2015 | -0.121939527 | 0.019549683 |
| 8/1/2015 | -0.043485446 | -0.064624731 |
| 9/1/2015 | 0.025067099 | -0.026798731 |
| 10/1/2015 | -0.078577301 | 0.079719379 |
| 11/1/2015 | 0.047029033 | 0.000504742 |
| 12/1/2015 | 0.056257819 | -0.017685659 |
| 1/1/2016 | -0.302996218 | -0.052067617 |
| 2/1/2016 | 0.202912827 | -0.004136906 |
| 3/1/2016 | 0.074574737 | 0.06390499 |
| 4/1/2016 | 0.153553957 | 0.002695762 |
| 5/1/2016 | -0.18644828 | 0.015208367 |
| 6/1/2016 | 0.002902807 | 0.000910506 |
| 7/1/2016 | 0.135955619 | 0.034990433 |
| 8/1/2016 | -0.052185714 | -0.001219987 |
| 9/1/2016 | 0.008845955 | -0.001235213 |
| 10/1/2016 | -0.12794767 | -0.019616837 |
| 11/1/2016 | 0.301002453 | 0.033603545 |
| 12/1/2016 | -0.027282474 | 0.018037111 |
| 1/1/2017 | 0.260883907 | 0.017726315 |
| 2/1/2017 | -0.052376863 | 0.036523001 |
| 3/1/2017 | -0.005508 | -0.000389273 |
| 4/1/2017 | -0.019668973 | 0.009050132 |
| 5/1/2017 | -0.023699955 | 0.011509759 |
| 6/1/2017 | -0.008842777 | 0.004802226 |
| 7/1/2017 | 0.108723913 | 0.019164018 |
| 8/1/2017 | 0.186889829 | 0.000546284 |
| 9/1/2017 | 0.060570954 | 0.019119039 |
| 10/1/2017 | 0.024577509 | 0.02194556 |
| 11/1/2017 | -0.121820059 | 0.003713141 |
| 12/1/2017 | 0.241786656 | 0.033766015 |
| 1/1/2018 | -0.034945458 | 0.054657399 |
| 2/1/2018 | -0.145632637 | -0.039726108 |
| 3/1/2018 | -0.00022244 | -0.027252497 |
| 4/1/2018 | 0.129966368 | 0.002715086 |
| 5/1/2018 | -0.06308127 | 0.021378191 |
| 6/1/2018 | -0.025067115 | 0.004830749 |
| 7/1/2018 | -0.080131612 | 0.035387951 |
| 8/1/2018 | 0.031842536 | 0.029814315 |
| 9/1/2018 | -0.100472256 | 0.004285093 |
| 10/1/2018 | -0.143767471 | -0.071929346 |
| 11/1/2018 | -0.095281689 | 0.017701752 |
| 12/1/2018 | -0.098711084 | -0.047137951 |
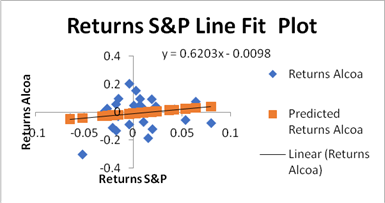
For First half of the data that is for 30 months, we run the regression between Alcoa and S&P to get this as an output.
Regression equation for the first 30 months is
Y = 0.6203X − 0.0098
From this equation the
Beta = slope of regression line = 0.6203
Alpha = intercept of regression line = 0.0098

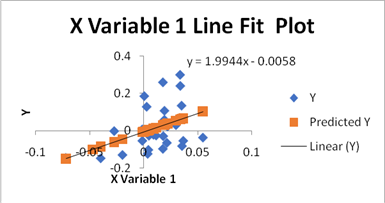
For next half of the data that is for 30 months, we run the regression between Alcoa and S&P to get this as an output.
Regression equation for the first 30 months is
Y = 1.9944X − 0.0058
From this equation the
Beta = slope of regression line = 0.1.9944
Alpha = intercept of regression line = 0.0058

From this we can interpret that the for the first 30 months beta is quite lower as compared to the next 30 months. Also Alpha increased from negative 0.0098 to negative 0.0058 for the last 30 months meaning that the stock became more volatile and riskier and was giving more returns.
Want to see more full solutions like this?
Chapter 7 Solutions
Essentials of Investments (The Mcgraw-hill/Irwin Series in Finance, Insurance, and Real Estate)
- What is the up movement of a tree with 3 month step expiry one year the current price of the tree is 60 and vol is 30% 109.33 109.01 108.78 NONE OF THE ABOVEarrow_forwardAssume a volatility of 25%. What is going to be the hedging ratio for a replicating portfolio for an option that pays $1$ in the case of good state of the world and $0$ in the bas state of the world. Assume the option expires in half a year and the current stock price is 20$ 0.07 0.14 0.25 NONE OF THE ABOVEarrow_forwardAssume you know the ZC value with principal of 11$ is worth 5$ now. What is the put option value expiring at the same time of this ZC ( I did it in class when I discussed ZC) 6 7 5 NONE OF THE ABOVEarrow_forward
- what is going to be the hedge ratio of American put option that expires in one year modeled with a binomial tree of 3 months step with year to expiry? assume the underlying is oil future with RF of 5% and vol of oil is 30%. Strike is 70 and price is 60 of oil. -0.63 -0.7 -0.76arrow_forwardwhat is going to be the sign of the alpha in a put replicating portfolio for a tree NEGATIVE POSITiVE SOMETIMES POSITIVE SOMETIMES NEGATIVE NONE OF THDE ABOVEarrow_forwardWhat is corporate finance? can you help me in this question?arrow_forward
- what is going to be the value of American put option that expires in one year modeled with a binomial tree of 3 months step with year to expiry? assume the underlying is oil future with RF of 5% and vol of oil is 30%. Strike is 70 and price is 60 of oil. 13.68 13.44 13.01arrow_forwardfinance problem i need help step by step..arrow_forwardSuppose that you are a U.S.-based importer of goods from the United Kingdom. You expect the value of the pound to increase against the U.S. dollar over the next 30 days. You will be making payment on a shipment of imported goods in 30 days and want to hedge your currency exposure. The U.S. risk-free rate is 5.5 percent, and the U.K. risk-free rate is 4.5 percent. These rates are expected to remain unchanged over the next month. The current spot rate is $1.90. 1.Move forward 10 days. The spot rate is $1.93. Interest rates are unchanged. Calculate the value of your forward position. Do not round intermediate calculations. Round your answer to 4 decimal places.arrow_forward
- Don't solve. I mistakenly submitted blurr image please comment i will write values. please dont Solve with incorrect values otherwise unhelpful.arrow_forwardThe image is blurr please comment i will write values. please dont Solve with incorrect values otherwise unhelpful.arrow_forwardQuestion 6 A five-year $50,000 endowment insurance for (60) has $1,000 underwriting expenses, 25% of the first premium is commission for the agent of record and renewal expenses are 5% of subsequent premiums. Write the gross future loss random variable: Presuming a portfolio of 10,000 identical and independent policies, the expected loss and the variance of the loss of the portfolio are given below (note that the premium basis is not given or needed): E[L] = 10,000(36,956.49 - 3.8786P) V[L] 10,000 (50,000 + 14.52P)². 0.00095 Find the premium that results in a 97.5% probability of profit (i.e. ¹ (0.975) = 1.96). Premium: Please show your work belowarrow_forward
 Essentials Of InvestmentsFinanceISBN:9781260013924Author:Bodie, Zvi, Kane, Alex, MARCUS, Alan J.Publisher:Mcgraw-hill Education,

 Foundations Of FinanceFinanceISBN:9780134897264Author:KEOWN, Arthur J., Martin, John D., PETTY, J. WilliamPublisher:Pearson,
 Fundamentals of Financial Management (MindTap Cou...FinanceISBN:9781337395250Author:Eugene F. Brigham, Joel F. HoustonPublisher:Cengage Learning
 Corporate Finance (The Mcgraw-hill/Irwin Series i...FinanceISBN:9780077861759Author:Stephen A. Ross Franco Modigliani Professor of Financial Economics Professor, Randolph W Westerfield Robert R. Dockson Deans Chair in Bus. Admin., Jeffrey Jaffe, Bradford D Jordan ProfessorPublisher:McGraw-Hill Education


