
Concept explainers
Videos
(Supplement 7A) Recording Inventory Transactions, Making Accrual and Deferral Adjustments, and Preparing and Evaluating Financial Statements (Chapters 4, 6, and 7)
College Coasters is a San Diego–based merchandiser specializing in logo-adorned drink coasters. The company reported the following balances in its unadjusted
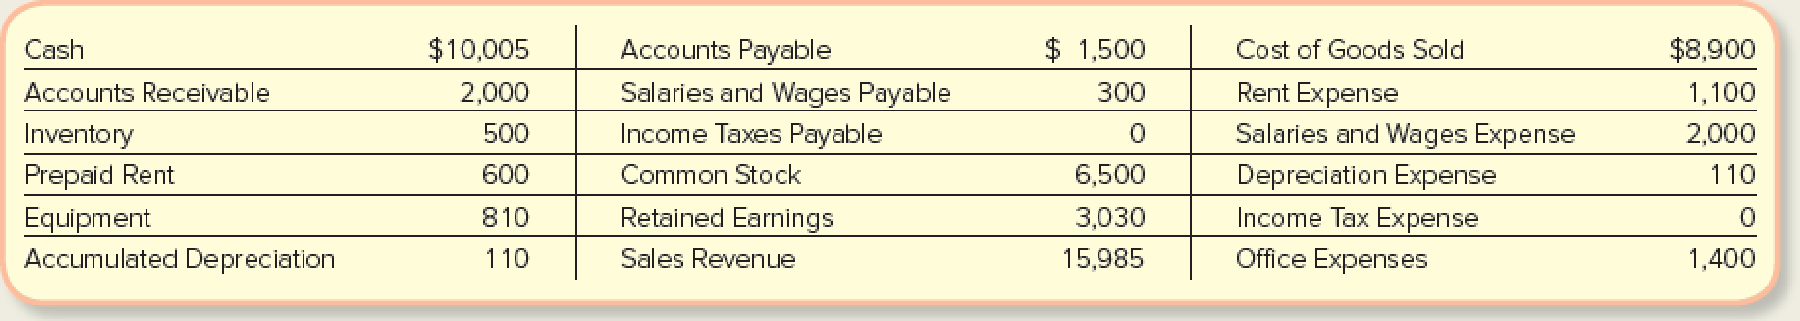
The company buys coasters from one supplier. All amounts in Accounts Payable on December 1 are owed to that supplier. The inventory on December 1 consisted of 1,000 coasters, all of which were purchased in a batch on July 10 at a unit cost of $0.50. College Coasters records its inventory using perpetual inventory accounts and the FIFO cost flow method.
During December, the company entered into the following transactions. Some of these transactions are explained in greater detail below.
- a. Purchased 500 coasters on account from the regular supplier on 12/1 at a unit cost of $0.52, with terms of n/60.
- b. Purchased 1,000 coasters on account from the regular supplier on 12/2 at a unit cost of $0.55, with terms of n/60.
- c. Sold 2,000 coasters on account on 12/3 at a unit price of $0.90.
- d. Collected $1,000 from customers on account on 12/4.
- e. Paid the supplier $1,600 cash on account on 12/18.
- f. Paid employees $500 on 12/23, of which $300 related to work done in November and $200 was for wages up to December 22.
- g. Loaded 100 coasters on a cargo ship on 12/31 to be delivered the following week to a customer in Kona, Hawaii. The sale was made FOB destination with terms of n/60.
Other relevant information includes the following at 12/31:
- h. College Coasters has not yet recorded $200 of office expenses incurred in December on account.
- i. The company estimates that the equipment depreciates at a rate of $10 per month. One month of
depreciation needs to be recorded. - j. Wages for the period from December 23–31 are $100 and will be paid on January 15.
- k. The $600 of Prepaid Rent relates to a six-month period ending on May 31 of next year.
- l. The company incurred $789 of income tax but has made no tax payments this year.
- m. No shrinkage or damage was discovered when the inventory was counted on December 31.
- n. The company did not declare dividends and there were no transactions involving common stock.
Required:
- 1. Analyze the
accounting equation effects of items a–n. - 2. Prepare
journal entries required for items a–n. - 3. Summarize the journal entries in T-accounts. Be sure to include the balances on December 1 as beginning account balances. Calculate ending balances and prepare a trial balance. (If you are completing this requirement in Connect, your journal entries will have been posted to T-accounts and a trial balance will have been prepared automatically.)
- 4. Prepare the year-end Income Statement and classified
Balance Sheet , using the formats presented in Exhibits 6.8 and 4.11. - 5. Calculate to one decimal place the inventory turnover ratio and days to sell, assuming that inventory was $500 on January 1 of this year. Evaluate these measures in comparison to an inventory turnover ratio of 21.0 during the previous year.
1.
Analyze the accounting equation effects of the given items.
Explanation of Solution
Accounting equation: Accounting equation is an accounting tool expressed in the form of equation, by creating a relation between resources or assets of a business and claims on the resources by the creditors, and the owners.
Analyze the accounting equation effects of the given items as follows:
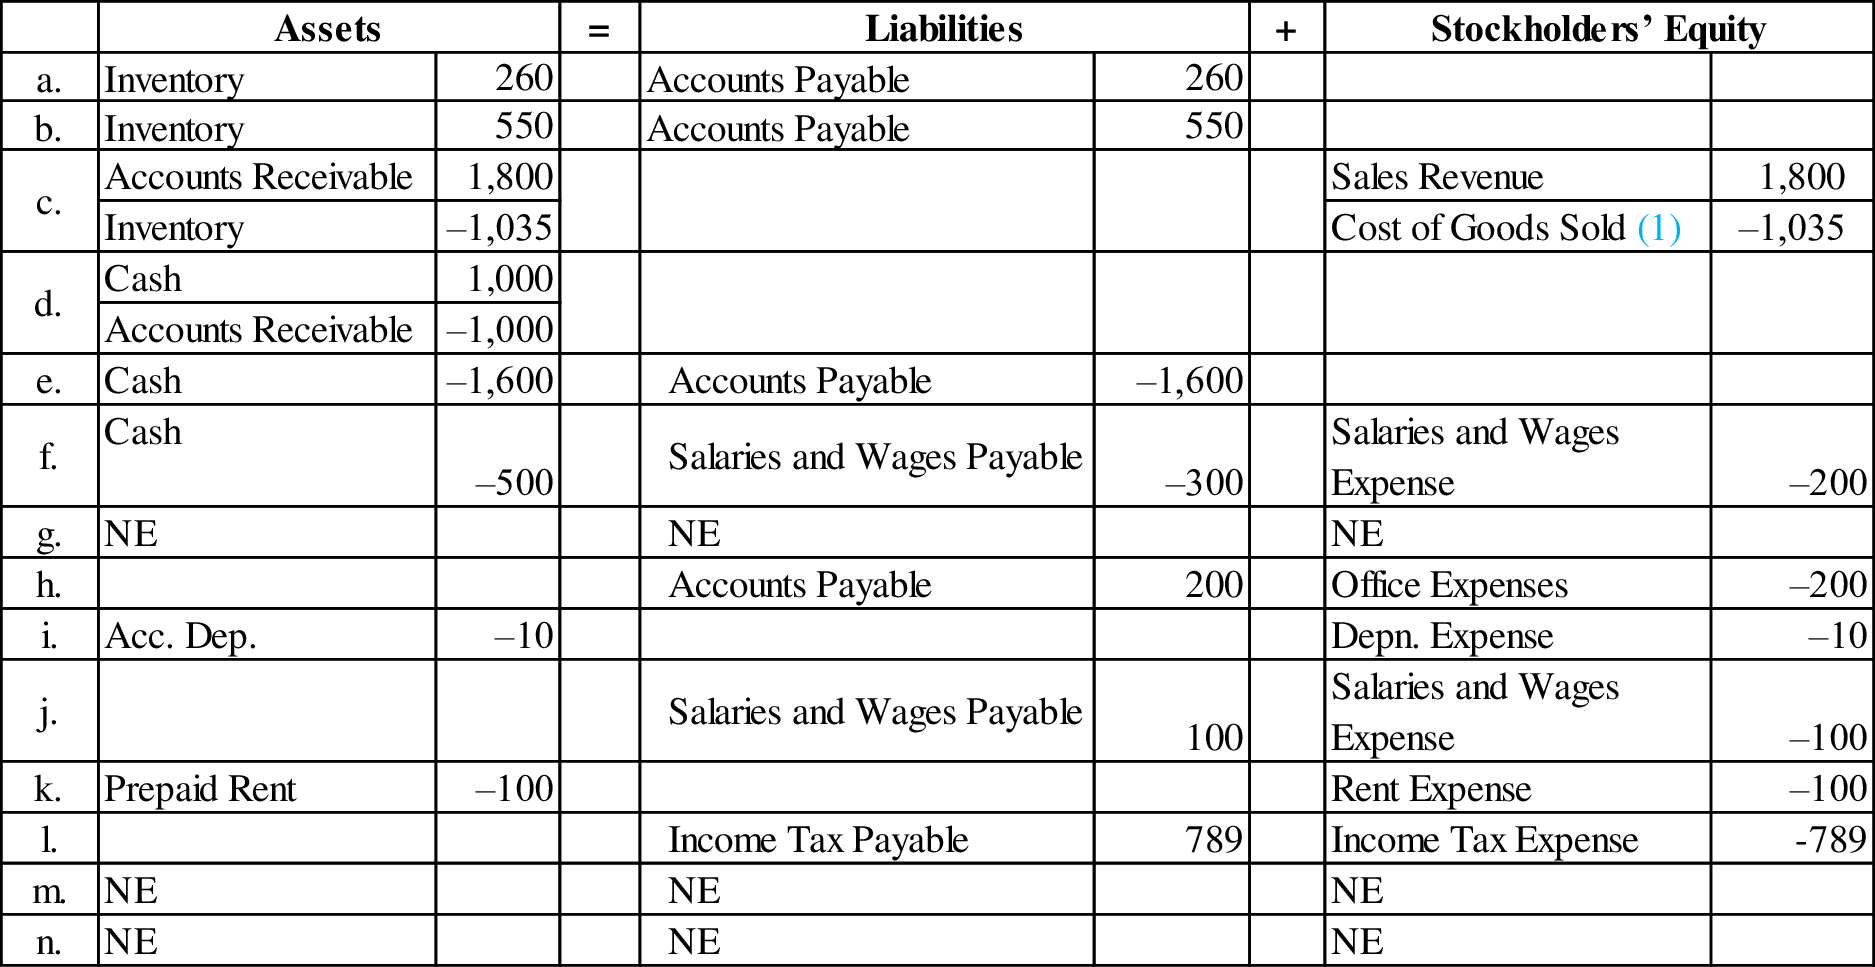
Figure (1)
Working note 1:
Calculate the amount of cost of goods sold:
Note:
Transaction g: Under the FOB destination terms, the sale and cost of sale are not recorded until the shipment reaches the buyer’s destination. In this case, the cargo ship did not reach the buyers’ designation (place H) till December 31.
Transaction m: Adjusting entry is not required for shrinkage, because shrinkage or damage would not be counted till December 31.
Transaction n: Adjusting entry is not required for dividend, because the company did not declare dividends.
2.
Prepare the journal entries for the items “a” to “n”.
Explanation of Solution
Journal entry: Journal entry is a set of economic events which can be measured in monetary terms. These are recorded chronologically and systematically.
| Date | Account Title and Explanation | Post | Debit ($) | Credit ($) | |
| Ref. | |||||
| a. | Inventory | 260 | |||
| Accounts Payable | 260 | ||||
| (To record the purchase of inventory on account) | |||||
| b. | Inventory | 550 | |||
| Accounts Payable | 550 | ||||
| (To record the purchase of inventory on account) | |||||
| c. | Accounts Receivable | 1,800 | |||
| Sales Revenue | 1,800 | ||||
| (To record the sale of coaster on account) | |||||
| Cost of Goods Sold (1) | 1,035 | ||||
| Inventory | 1,035 | ||||
| (To record the cost of goods sold) | |||||
| d. | Cash | 1,000 | |||
| Accounts Receivable | 1,000 | ||||
| (To record the cash received from credit customer) | |||||
| e. | Accounts Payable | 1,600 | |||
| Cash | 1,600 | ||||
| (To record the payment of cash to credit suppliers) | |||||
| f. | Salaries and Wages Expense | 200 | |||
| Salaries and Wages Payable | 300 | ||||
| Cash | 500 | ||||
| (To record the payment of salaries and wages expense partly for cash and partly on account) | |||||
| g. | No journal entry because the goods did not arrive at the destination. | ||||
| h. | Office Expenses | 200 | |||
| Accounts Payable | 200 | ||||
| (To record office expense incurred on account) | |||||
| i. | Depreciation Expense | 10 | |||
| Accumulated Depreciation–Equipment | 10 | ||||
| (To record the depreciation expense for the current year) | |||||
| j. | Salaries and Wages Expense | 100 | |||
| Salaries and Wages Payable | 100 | ||||
| (To record the accrued salary expense) | |||||
| k. | Rent Expense | 100 | |||
| Prepaid Rent | 100 | ||||
| (To record the accrued rent expense) | |||||
| l. | Income Tax Expense | 789 | |||
| Income Taxes Payable | 789 | ||||
| (To record the accrued tax expense on income tax payable) | |||||
| m. | No entry is required | ||||
| n. | No entry is required | ||||
Table (1)
3.
Prepare T- account for the above journal entry and prepare the adjusted trail balance.
Explanation of Solution
T-account: The condensed form of a ledger is referred to as T-account. The left-hand side of this account is known as debit, and the right hand side is known as credit.
Adjusted Trial Balance: Adjusted trial balance is that statement which contains complete list of accounts with their adjusted balances, after all relevant adjustments have been made. This statement is prepared at the end of every financial period.
Prepare T- account for the above journal entry as follows:
| Cash (A) | |||
| Beginning | 10,005 | ||
| d. | 1,000 | 1,600 | e. |
| 500 | f. | ||
| 8,905 | |||
| Accounts Receivable (A) | |||
| Beginning | 2,000 | ||
| c. | 1,800 | 1,000 | d. |
| 2,800 | |||
| Inventory (A) | |||
| Beginning | 500 | ||
| a. | 260 | 1,035 | c. |
| b. | 550 | ||
| 275 | |||
| Prepaid Rent (A) | |||
| Beginning | 600 | ||
| 100 | k. | ||
| 500 | |||
| Equipment (A) | |||
| Beginning | 810 | ||
| 810 | |||
| Accumulated Depreciation | |||
| 110 | Beginning | ||
| 10 | i. | ||
| 120 | |||
| Accounts Payable (L) | |||
| 1,500 | Beginning | ||
| 260 | a. | ||
| e. | 1,600 | 550 | b. |
| 200 | h. | ||
| 910 | |||
| Salaries and Wages Payable (L) | |||
| 300 | Beginning | ||
| f. | 300 | 100 | j. |
| 100 | |||
| Income Taxes Payable (L) | |||
| 0 | Beginning | ||
| 789 | l. | ||
| 789 | |||
| Common Stock (SE) | |||
| 6,500 | Beginning | ||
| 6,500 | |||
| Retained earnings (SE) | |||
| 3,030 | Beginning | ||
| 3,030 | |||
| Sales Revenue (R) | |||
| 15,985 | Beginning | ||
| 1,800 | c. | ||
| 17,785 | |||
| Cost of Goods Sold (E) | |||
| Beginning | 8,900 | ||
| c. | 1,035 | ||
| 9,935 | |||
| Rent Expense (E)– | |||
| Beginning | 1,100 | ||
| k. | 100 | ||
| 1,200 | |||
| Salaries and Wages Expense (E) | |||
| Beginning | 2,000 | ||
| f. | 200 | ||
| j. | 100 | ||
| 2,300 | |||
| Depreciation Expense (E) | |||
| Beginning | 110 | ||
| i. | 10 | ||
| 120 | |||
| Income Tax Expense (E) | |||
| Beginning | 0 | ||
| l. | 789 | ||
| 789 | |||
| Office Expenses (E) | |||
| Beginning | 1,400 | ||
| h. | 200 | ||
| 1,600 | |||
Table (2)
Prepare the adjusted trail balance as follows:
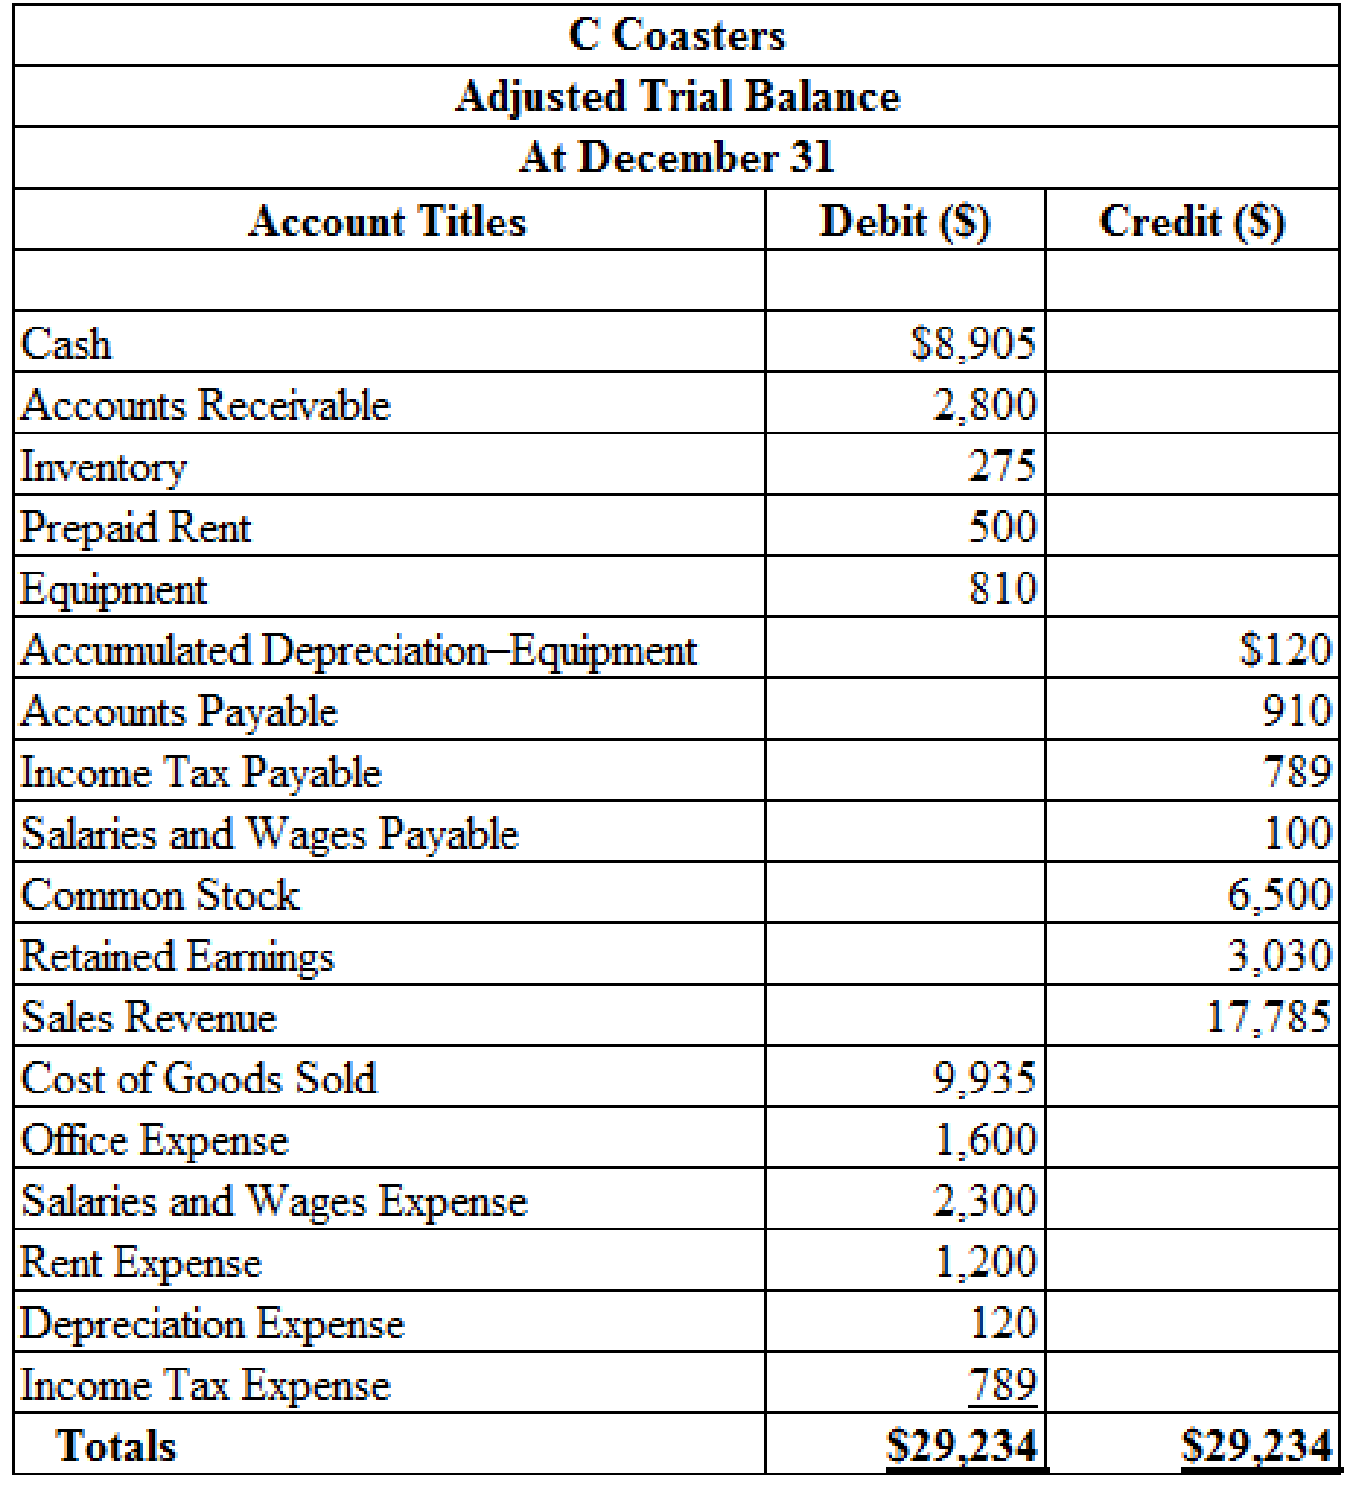
Figure (2)
4.
Prepare the year-end income statement and classified balance sheet.
Explanation of Solution
Income statement: The financial statement which reports revenues and expenses from business operations and the result of those operations as net income or net loss for a particular time period is referred to as income statement.
Classified balance sheet: The main elements of balance sheet assets, liabilities, and stockholders’ equity are categorized or classified further into sections, and sub-sections in a classified balance sheet. Assets are further classified as current assets, long-term investments, property, plant, and equipment (PPE), and intangible assets. Liabilities are classified into two sections current and long-term. Stockholders’ equity comprises of common stock and retained earnings. Thus, the classified balance sheet includes all the elements under different sections.
Prepare the year-end income statement as follows:
| C Coasters | ||
| Income statement | ||
| For the Year Ended December 31 | ||
| Account Titles | ($) | ($) |
| Sales Revenues | 17,785 | |
| Less: Cost of Goods Sold | 9,935 | |
| Gross Profit | 7,850 | |
| Less: Operating Expenses: | ||
| Salaries and Wages Expense | 2,300 | |
| Office Expenses | 1,600 | |
| Rent Expense | 1,200 | |
| Depreciation Expense | 120 | |
| Total Operating Expenses | 5,220 | |
| Income before Income Tax Expense | 2,630 | |
| Less: Income Tax Expense | 789 | |
| Net Income | 1,841 | |
Table (3)
Prepare the classified balance sheet as follows:
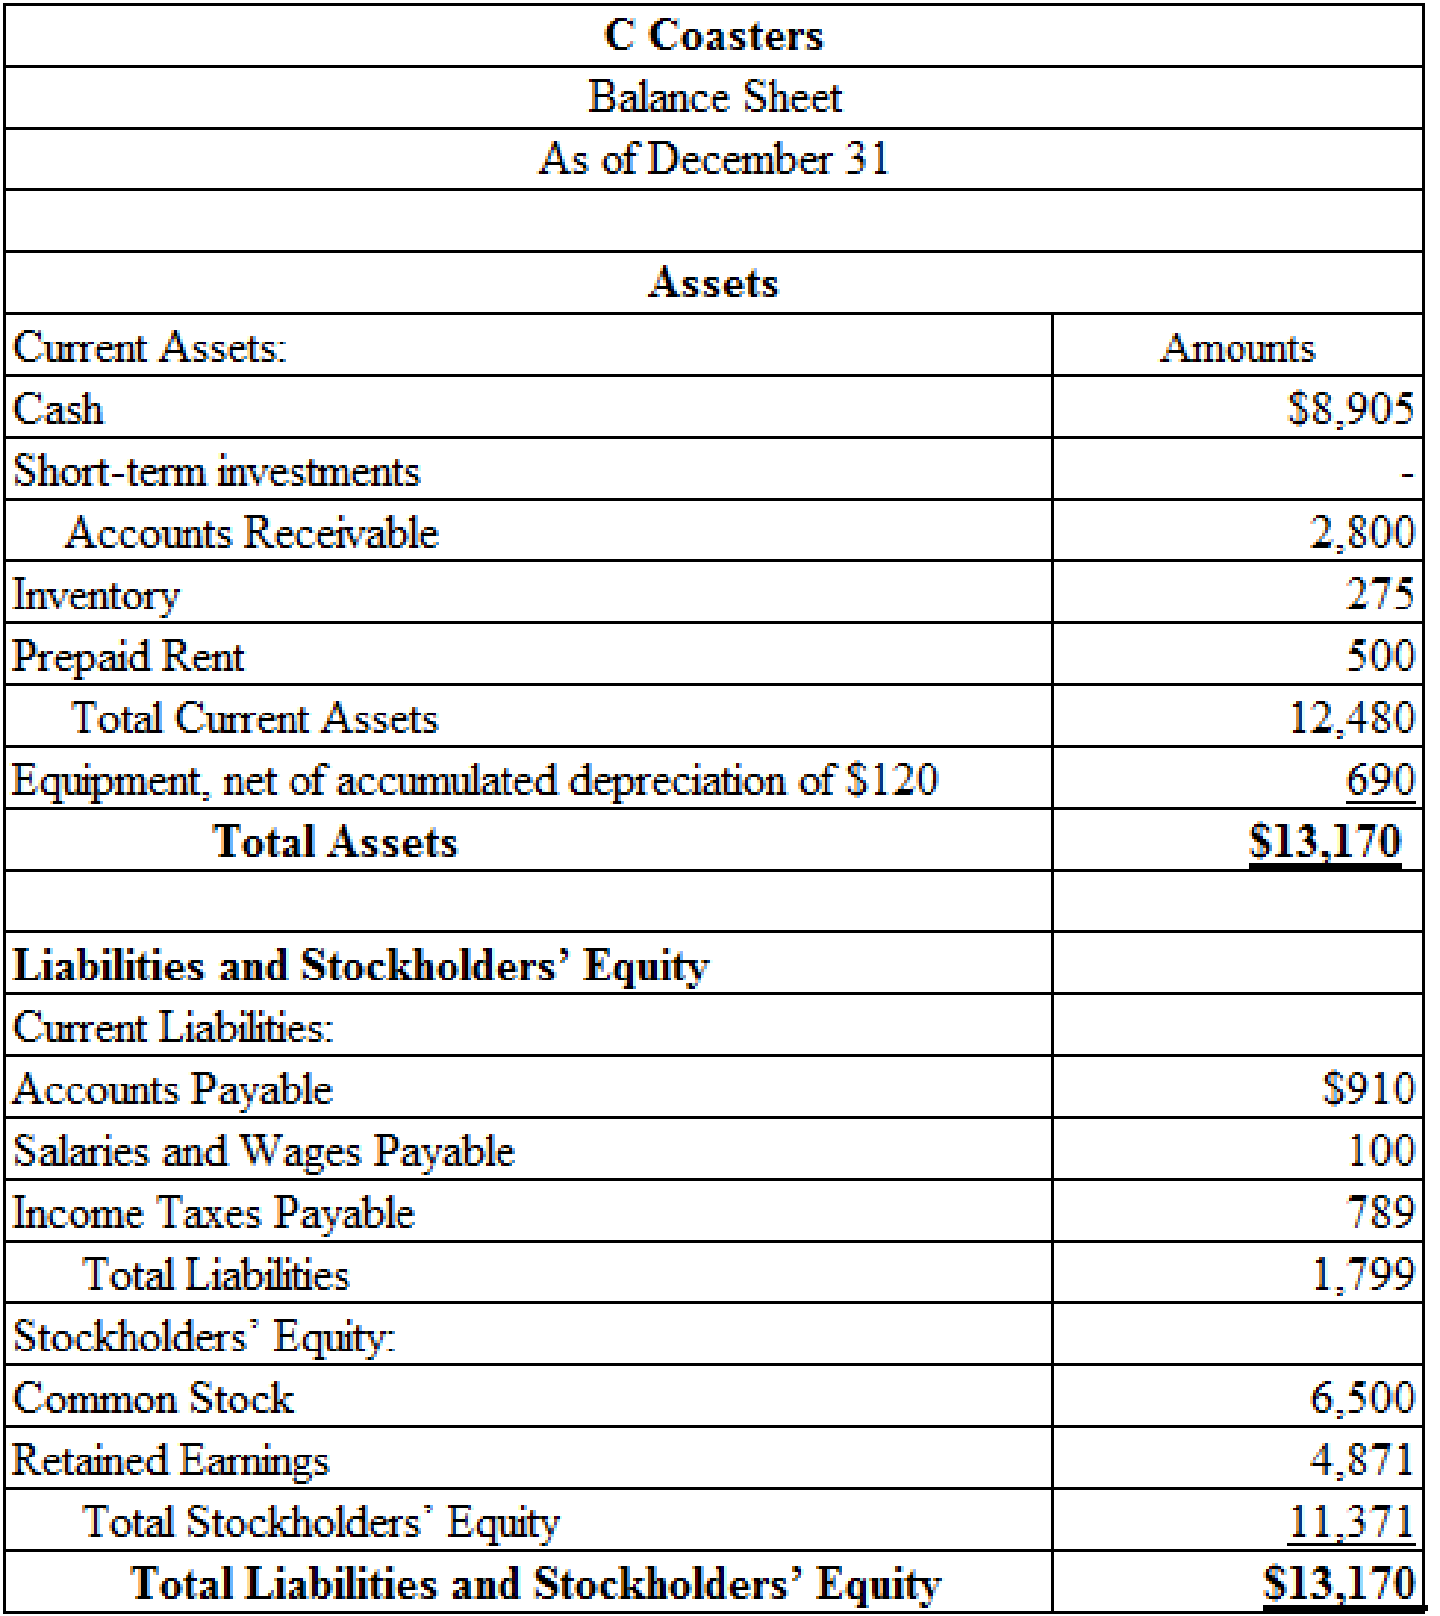
Figure (3)
5.
Calculate the inventory turnover ratio and days to sell.
Explanation of Solution
Inventory turnover: This is the ratio which analyzes the number of times inventory is sold during the period. This ratio gauges the efficacy of inventory management. Larger the ratio, more efficient the inventory management.
Average days to sell inventory (average days in inventory): This ratio analyzes the period from the time inventory is acquired, to the period it is sold, in the period. This ratio measures the period inventory is held with the company. So, this ratio also gauges the efficacy of inventory management. Lower the ratio, more efficient the inventory management.
Calculate the inventory turnover ratio:
Working note 2:
Calculate the average inventory.
Calculate the day’s sales in inventory:
By comparing to the last year’s inventory turnover ratio of 21.0 times per year, the company has intensely improved how quickly to sells its inventory and the days have decreased from 30.4 days to 14.3 days.
Want to see more full solutions like this?
Chapter 7 Solutions
FUNDAMENTALS OF FINANCIAL ACCOUNTING LL


 Principles of Accounting Volume 1AccountingISBN:9781947172685Author:OpenStaxPublisher:OpenStax College
 College Accounting (Book Only): A Career ApproachAccountingISBN:9781337280570Author:Scott, Cathy J.Publisher:South-Western College Pub
 Financial AccountingAccountingISBN:9781337272124Author:Carl Warren, James M. Reeve, Jonathan DuchacPublisher:Cengage Learning