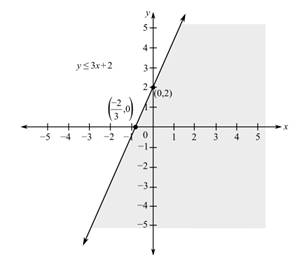
To graph: Graph of the given linear inequality:
Explanation of Solution
Given:
Graph:
The provided linear inequality is
Replace inequality symbol with equality and rewrite the equation as follows:
To find x-intercept, substitute
To find y-intercept, substitute
Now, take origin as test point and check which region to shade:
As the above expression is true, the shaded region will contain the test point, that is, origin. So, the line passes through points

Hence, the graph of the provided inequality line passes through points
Want to see more full solutions like this?
Chapter 7 Solutions
EBK MATHEMATICS WITH APPLICATIONS IN TH
- Solve the following systems of equations and show all work.y = x2 + 3y = x + 5 Please type out answerarrow_forwardSolve the following system of equations. Show all work and solutions.y = 2x2 + 6x + 1y = −4x2 + 1 Please type out answerarrow_forwardDalia buys 20 collectible gems per month. Grace sells 10 gems from her collection of 120 each month. When will Dalia have more gems than Grace? Show your work. Dear Student If You Face any issue let me know i will solve your all doubt. I will provide solution again in more detail systematic and organized way. I would also like my last 3 questions credited to mearrow_forward
- Dalia buys 20 collectible gems per month. Grace sells 10 gems from her collection of 120 each month. When will Dalia have more gems than Grace? Show your work.arrow_forwardQuestion 1 20 pts Test data on the bending strength of construction wood poles of various diameter are presented below assuming the same length. Kip- 1000 lbf. Using the following data with 2nd order Newton polynomial interpolation, we want to determine the strength of the material for x=4.9 in. Which data point will be used as x? After you found x0, enter the value of x-xo in the solution. Answer shall be in one decimal place. Distance (in) Strength (kips) 100 3.6 1.1 5.6 3.6 5.6 200 300 400 500arrow_forwardSolve the following system of equations. Show all work and solutions.y = 2x2 + 6x + 1y = −4x2 + 1arrow_forward
- Solve the following systems of equations and show all work.y = x2 + 3y = x + 5arrow_forwardTest data on the bending strength of construction wood poles of various diameter are presented below assuming the same length. Kip- 1000 lbf. Using the following data with 2nd order Newton polynomial interpolation, we want to determine the strength of the material for x=4.3 in. Which data point will be used as x0? After you found x0, enter the value of x-xo in the solution. Answer shall be in one decimal place. Distance (in) Strength (kips) 100 2.7 1 6.8 0.6 5.7 200 300 400 500arrow_forwardA test consists of 10 questions made of 5 answers with only one correct answer. To pass the test, a student must answer at least 8 questions correctly. (a) If a student guesses on each question, what is the probability that the student passes the test? (b) Find the mean and standard deviation of the number of correct answers. (c) Is it unusual for a student to pass the test by guessing? Explain.arrow_forward
- In a group of 40 people, 35% have never been abroad. Two people are selected at random without replacement and are asked about their past travel experience. a. Is this a binomial experiment? Why or why not? What is the probability that in a random sample of 2, no one has been abroad? b. What is the probability that in a random sample of 2, at least one has been abroad?arrow_forward2/2. prove that if G is Euler then so is L (G).arrow_forwardQ10. What are the chromatic numbers of the following two graphs? G H A. x(G) = 2 and x(H) = 2 B. x(G) = 2 and x(H) = 3 C. x(G) = 3 and x(H) = 2 D. X(G) = 3 and x(H) = 3 E. x(G) = 4 and x(H) = 3arrow_forward
 Discrete Mathematics and Its Applications ( 8th I...MathISBN:9781259676512Author:Kenneth H RosenPublisher:McGraw-Hill Education
 Mathematics for Elementary Teachers with Activiti...MathISBN:9780134392790Author:Beckmann, SybillaPublisher:PEARSON
 Thinking Mathematically (7th Edition)MathISBN:9780134683713Author:Robert F. BlitzerPublisher:PEARSON
 Discrete Mathematics With ApplicationsMathISBN:9781337694193Author:EPP, Susanna S.Publisher:Cengage Learning,
 Pathways To Math Literacy (looseleaf)MathISBN:9781259985607Author:David Sobecki Professor, Brian A. MercerPublisher:McGraw-Hill Education


