
Concept explainers
Videos
To explain: The reason behind the sugar alcohol (monosaccharide derivatives) is no longer designated as D or L.
Introduction:
Monosaccharide having five carbons is known as pentose. The molecular formula of carbohydrate is Cn(H2O)n where n represents a whole number like 3 or higher. Monosaccharide contains various
Answer to Problem 1P
Answer: Fig.1 represents the structure of glyceraldehyde.
Pictorial representation: Fig.1 represents the structure of glyceraldehyde.
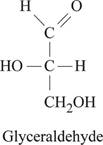
Fig.1: Structure of glyceraldehyde.
Explanation of Solution
Explanation:
Glyceraldehyde belongs to a group of monosaccharide and chemical formula for glyceraldehyde is C3H6O3. The carbonyl group present at 1st position of glyceraldehyde gets reduced into hydroxyl group. This reduction of carbonyl group results in the formation of glycerol structure. Fig.1 represents the structure of glyceraldehyde.
If the central carbon atom of a compound is bonded with four different functional groups, then the compound is said to be non-super imposable. On the basis of the arrangement of H and OH group present in chiral carbon atom, the compound is designated as D or L forms. L-form of glyceraldehyde has the -OH groups at the chiral center present far from carbonyl on the left side of the molecule. In D-form, glyceraldehyde has the -OH groups at the chiral center present far from carbonyl on the right side of the molecule. In glycerol, there is no chiral carbon is present. Thus, the sugar alcohol is no longer designated as D or L-form.
Want to see more full solutions like this?
Chapter 7 Solutions
SaplingPlus for Lehninger Principles of Biochemistry (Six-Month Access)


- fill in the table and circle the active sitearrow_forwardThe two half reactions for beginning and end of the electron transport chain are given below in standard form. Calculate & for the overall process. Using the Nernst equation (AG° = -n Fo, F= 96.485 kJ/volt mol), calculate AG°. Explain the need for a stepwise process in the electron transport chain. NAD* + H+ + 2 e- = NADH ½ 0г + 2H+ + 2е- = H20 = -0.32v E = +0.82Varrow_forwardanswer the questions and the example steps should be from carbohydrates glycolysis and citric acid cycle. Please put down reactions and structuresarrow_forward
- identify the general type of reaction catalyzed and an example step from glycolisis structure for each of the following enzymes/ co factor Kinase, isomerase, mutase, dehydrogenase, NAD+ , FADarrow_forwardfill in the blanks with the missing structures and give namesarrow_forwardfill in the table and identify the general type of reaction catalayzed and an example step from the structures in the second page so you will answer the questions from the first page the second one is just a reference urgently!arrow_forward
- Please draw out the molecular structures of each molecule and show how each enzyme + cofactor would affect the following molecule in the human metabolic pathway. (This is a metabolic map)arrow_forwardPlease draw out the molecular structures of each molecule and show how an enzyme + cofactor would affect the following molecule in the human metabolic pathway to create energy.arrow_forwardPlease draw out the molecular structures of each molecule and show how each enzyme + cofactor would affect the following molecule in the human metabolic pathway.arrow_forward
- Please draw out the mechanism with curved arrows showing electron flow. Pyruvate is accepted into the TCA cycle by a “feeder” reaction using the pyruvate dehydrogenase complex, resulting in acetyl-CoA and CO2. Provide the mechanism for this reaction utilizing the TPP cofactor. Include the roles of all cofactors.arrow_forwardPyruvate is accepted into the TCA cycle by a “feeder” reaction using the pyruvate dehydrogenase complex, resulting in acetyl-CoA and CO2. Provide the mechanism for this reaction utilizing the TPP cofactor. Include the roles of all cofactors.arrow_forwardThe mitochondrial ATP synthase has 10 copies of the F0 subunit “c”, and the [H ] in the mitochondrial inner membrane space (IMS) is 6.31 x 10⁻⁸ M and the [H + ] in the matrix is 3.16 x 10⁻⁹ M. Calculate the minimum membrane potential (∆Ψ) necessary to make ATP synthesis thermodynamically favorable. [Assume ∆G' ofphosphate hydrolysis of ATP is - 45 kJ/mol.]arrow_forward
 BiochemistryBiochemistryISBN:9781319114671Author:Lubert Stryer, Jeremy M. Berg, John L. Tymoczko, Gregory J. Gatto Jr.Publisher:W. H. Freeman
 Lehninger Principles of BiochemistryBiochemistryISBN:9781464126116Author:David L. Nelson, Michael M. CoxPublisher:W. H. Freeman
 Fundamentals of Biochemistry: Life at the Molecul...BiochemistryISBN:9781118918401Author:Donald Voet, Judith G. Voet, Charlotte W. PrattPublisher:WILEY
 BiochemistryBiochemistryISBN:9781305961135Author:Mary K. Campbell, Shawn O. Farrell, Owen M. McDougalPublisher:Cengage Learning
 BiochemistryBiochemistryISBN:9781305577206Author:Reginald H. Garrett, Charles M. GrishamPublisher:Cengage Learning
 Fundamentals of General, Organic, and Biological ...BiochemistryISBN:9780134015187Author:John E. McMurry, David S. Ballantine, Carl A. Hoeger, Virginia E. PetersonPublisher:PEARSON